- The 2026 industry standard for calculating YouTube engagement is the View-Based Formula: (Likes + Comments + Shares) / Total Views × 100.
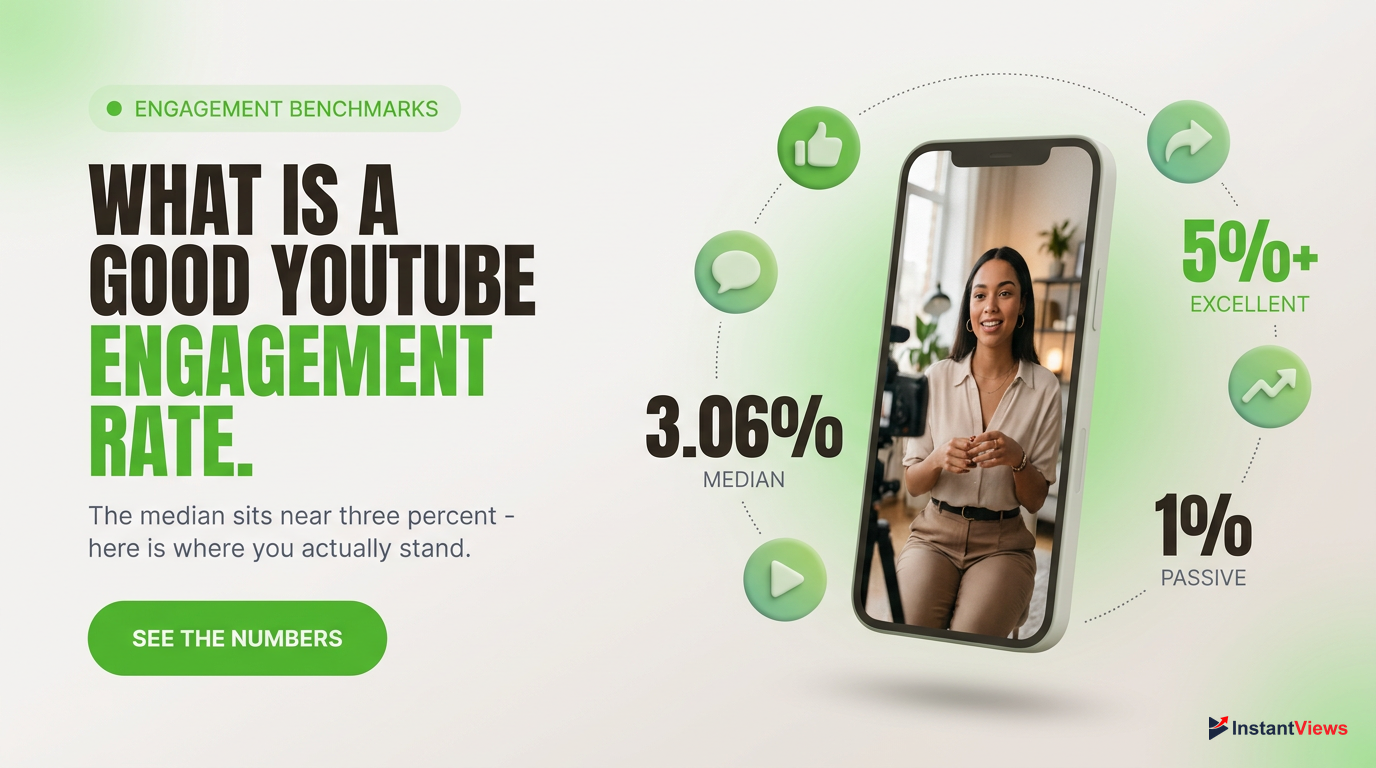
- The median engagement rate across all of YouTube is currently 3.06%, based on a study of 75,000 channels.
- Engagement rates have an inverse relationship with subscriber count; Nano channels (1K-10K) average 5.23%, while Mega channels (500K+) average 1.41%.
- YouTube Shorts generate significantly higher engagement rates (3.4% - 8%) compared to long-form videos (2% - 4%) due to the swipe-based interaction model.
- Content niche heavily impacts engagement; Tech Reviews average 3.94%, while Finance & Automotive average just 1.1%.
If you're wondering what a good engagement rate on YouTube actually looks like in 2026, you aren't alone. As the platform's algorithm continues to evolve, prioritizing watch time and non-subscriber reach, traditional metrics can feel confusing. Creators and brands alike need concrete, up-to-date benchmarks to measure true audience connection.
To answer this, we're diving deep into verified 2026 industry data, including a massive study of 75,000 channels by SociaVault Labs. We aren't just guessing; we are looking at the hard numbers that define success on the platform today, breaking down expectations by channel size, content format, and specific niches.
Whether you are a nano-creator just starting out or a brand analyzing potential macro-influencer partnerships, understanding these specific thresholds is crucial. Let's break down the exact formulas used by industry professionals and the verified benchmarks that determine if your YouTube engagement is poor, average, good, or truly exceptional.
- The Formulas to Calculate YouTube Engagement Rate
- Overall Thresholds: Poor, Average, Good, and Excellent
- Engagement Rate by Channel Size (Subscriber Tiers)
- Engagement Rate by Content Format: Long-Form vs. Shorts
- Engagement Rate by Content Niche: High Performers
- Engagement Rate by Content Niche: Lower Performers
- How to Find Your Engagement Metrics in YouTube Studio
- Why Engagement Rate Matters for the 2026 Algorithm
- Strategies to Improve Your YouTube Engagement Rate
- The Impact of Engagement Rate on Brand Sponsorships
- FAQ
The Formulas to Calculate YouTube Engagement Rate
Before you can determine if you have a good engagement rate on YouTube, you must calculate it correctly. In 2026, the industry relies on two primary formulas. However, because YouTube's algorithm now drives the vast majority of traffic to non-subscribers via the Homepage and Suggested Videos, one formula is heavily preferred by professionals.
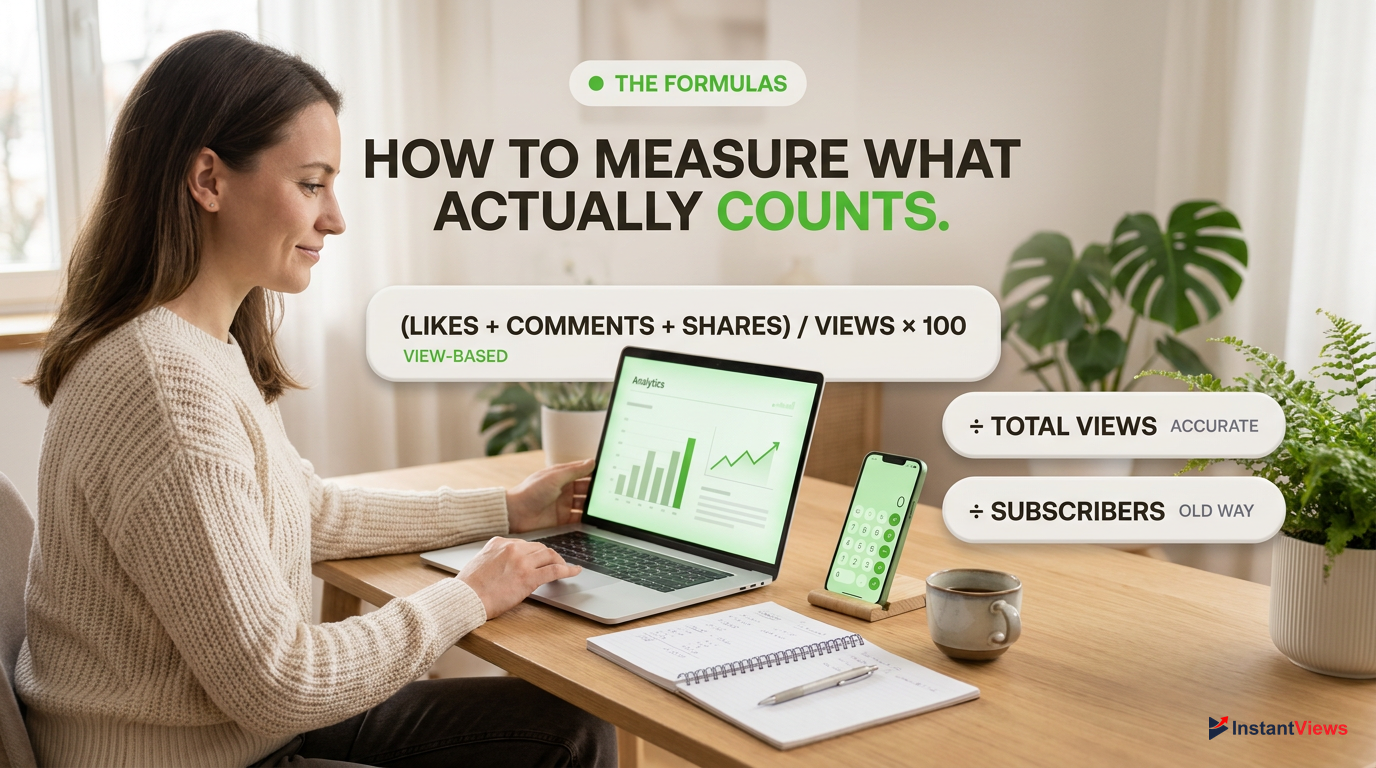
The View-Based Formula is the industry standard. It calculates engagement based on the people who actually watched the video, making it the most accurate measure of content quality. According to 2026 data from Elev8or.io and SociaVault Labs, this is the formula you should be using.
The View-Based Formula: (Likes + Comments + Shares) / Total Views × 100
The alternative is the Subscriber-Based Formula: (Likes + Comments + Shares) / Total Subscribers × 100. While InfluenceFlow (2026) notes this is still used to measure overall audience loyalty and long-term channel health, it typically yields much lower percentages and doesn't account for viral reach outside your core audience.
- Accurately measures content resonance.
- Accounts for viral, non-subscriber reach.
- Industry standard for brand sponsorships.
- Yields artificially low numbers for viral videos.
- Doesn't reflect the current algorithm's behavior.
- Less useful for evaluating individual video performance.
Overall Thresholds: Poor, Average, Good, and Excellent
When using the standard view-based formula, it's important to understand that engagement expectations are generally lower on YouTube than on platforms like TikTok or Instagram. This is due to the passive, long-form viewing habits inherent to the platform. So, what exactly constitutes a good engagement rate on YouTube?
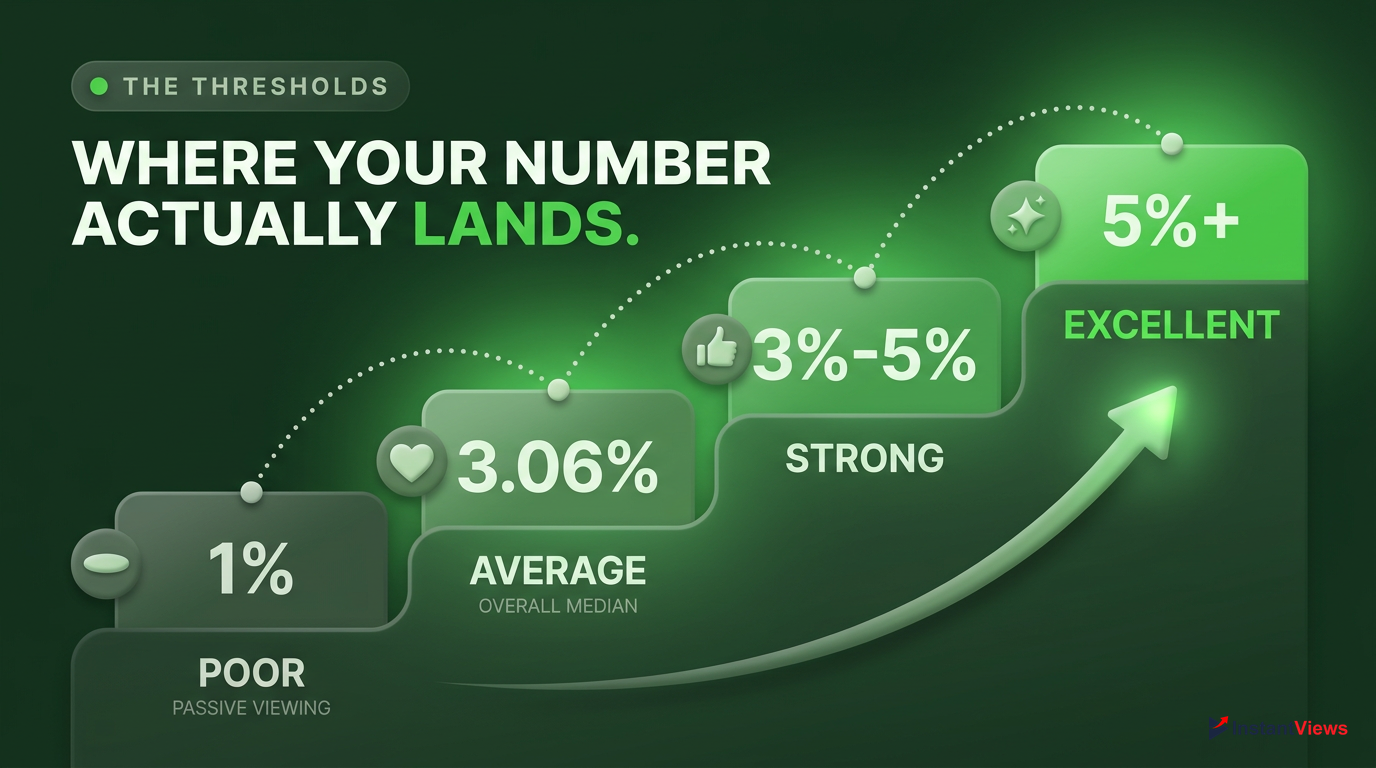
Based on a 2026 study of 75,000 channels by SociaVault Labs, the overall median engagement rate across all of YouTube sits at approximately 3.06%. This is your baseline for "average."
If your rate falls below 1%, Elev8or.io (2026) suggests this indicates passive viewership—audiences are watching but feel no connection to interact. A rate between 3% and 5% is considered strong (InfluenceFlow & Elev8or.io, 2026). Anything above 5% is excellent, and rates exceeding 8% to 10% enter "exceptional" or "viral" territory (HypeAuditor & InfluenceFlow, 2026).
Average
- Standard passive viewing
- Typical for most channels
Good
- Highly active community
- Strong viewer connection
Engagement Rate by Channel Size (Subscriber Tiers)
You cannot accurately assess a good engagement rate on YouTube without factoring in channel size. Engagement rates have a well-documented inverse relationship with subscriber count. Smaller channels typically boast highly dedicated, high-intent audiences, while larger channels reach broader, less-invested audiences via the algorithm.
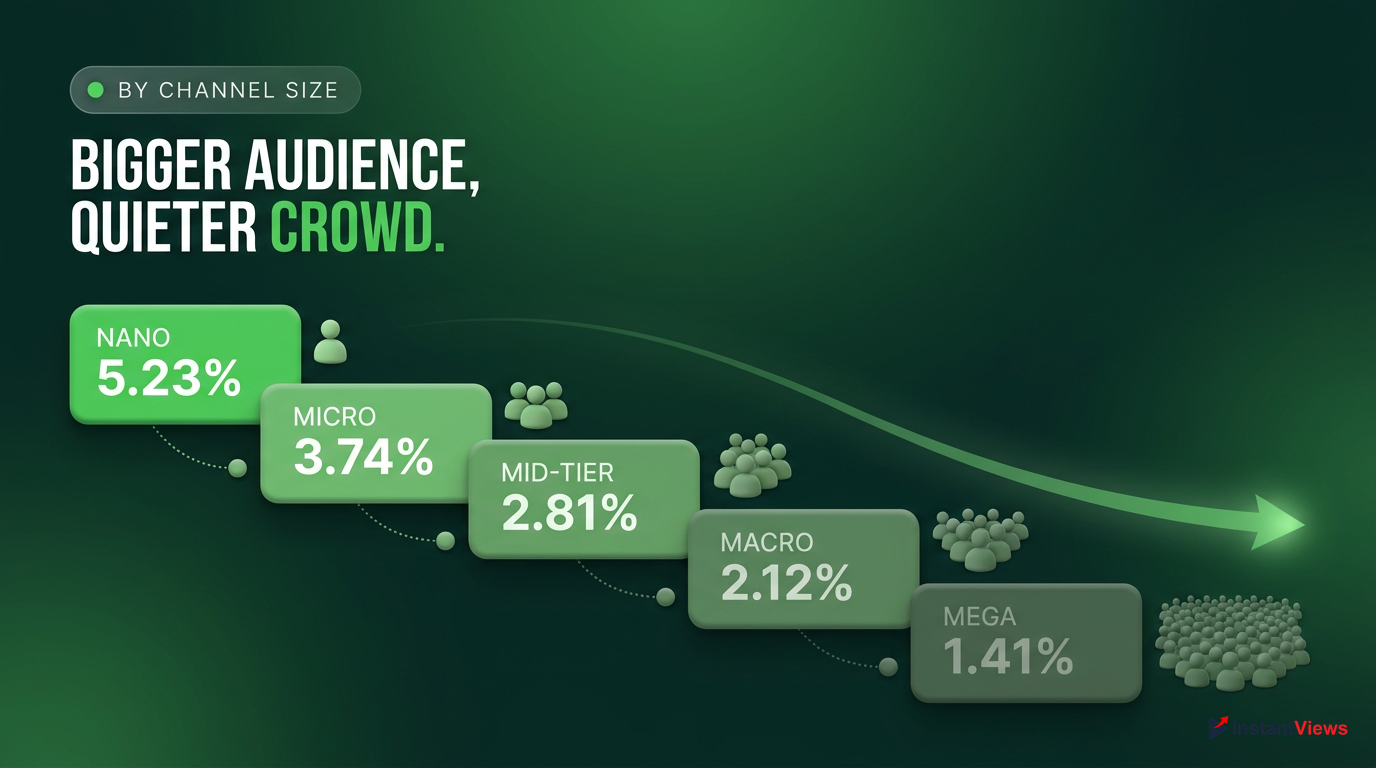
According to SociaVault Labs and Elev8or.io (2026), Nano channels (1K–10K subs) see a median engagement rate of 5.23%, with anything over 7% considered excellent. As channels grow, this number naturally drops. Micro channels (10K–50K subs) average 3.74%, and Mid-Tier channels (50K–100K subs) average 2.81%.
Macro channels (100K–500K subs), the tier most brands target for sponsorships, average a 2.12% engagement rate. For Mega channels (500K+), a drop to 1.41% is expected, and anything above 2% is considered incredibly strong.
Engagement Rate by Content Format: Long-Form vs. Shorts
The format of your content drastically alters what is considered a good engagement rate on YouTube. The platform is currently divided into two distinct viewing experiences: traditional long-form videos and YouTube Shorts. Each format encourages entirely different user behaviors.
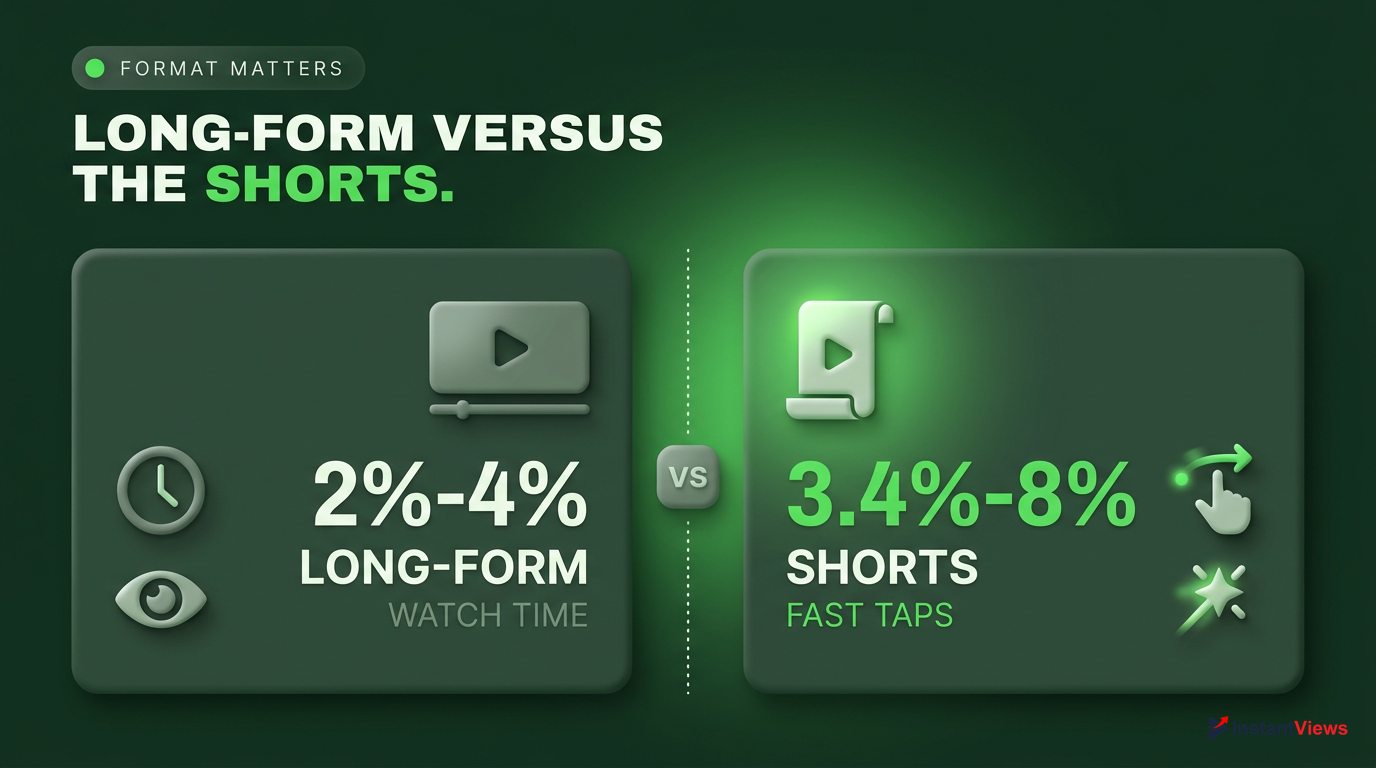
| Format | Average Rate | Primary Metric |
|---|---|---|
| Long-Form Videos | 2% - 4% | Watch Time / Retention |
| YouTube Shorts | 3.4% - 8% | High-Velocity Interaction |
Long-form videos average between 2% and 4% engagement (UpGrowth.in & InfluenceFlow, 2026). This format relies heavily on watch time and viewer retention rather than rapid-fire likes. Viewers are investing time, not necessarily taps.
Conversely, YouTube Shorts average between 3.4% and 8%. Shorts are prioritized heavily by the 2026 algorithm and generate much higher engagement percentages due to the high-velocity, swipe-based interaction model, even though they yield lower absolute watch time (UpGrowth.in & Mazkara Studio, 2026).
Don't compare your Shorts engagement directly to your long-form engagement. They are different ecosystems. Use Shorts to drive rapid engagement and subscriber growth, and long-form to build deep community connection and watch time.
Engagement Rate by Content Niche: High Performers
Engagement varies wildly depending on the type of content you produce. Some niches naturally invite debate, questions, or community interaction, leading to a higher baseline for a good engagement rate on YouTube.
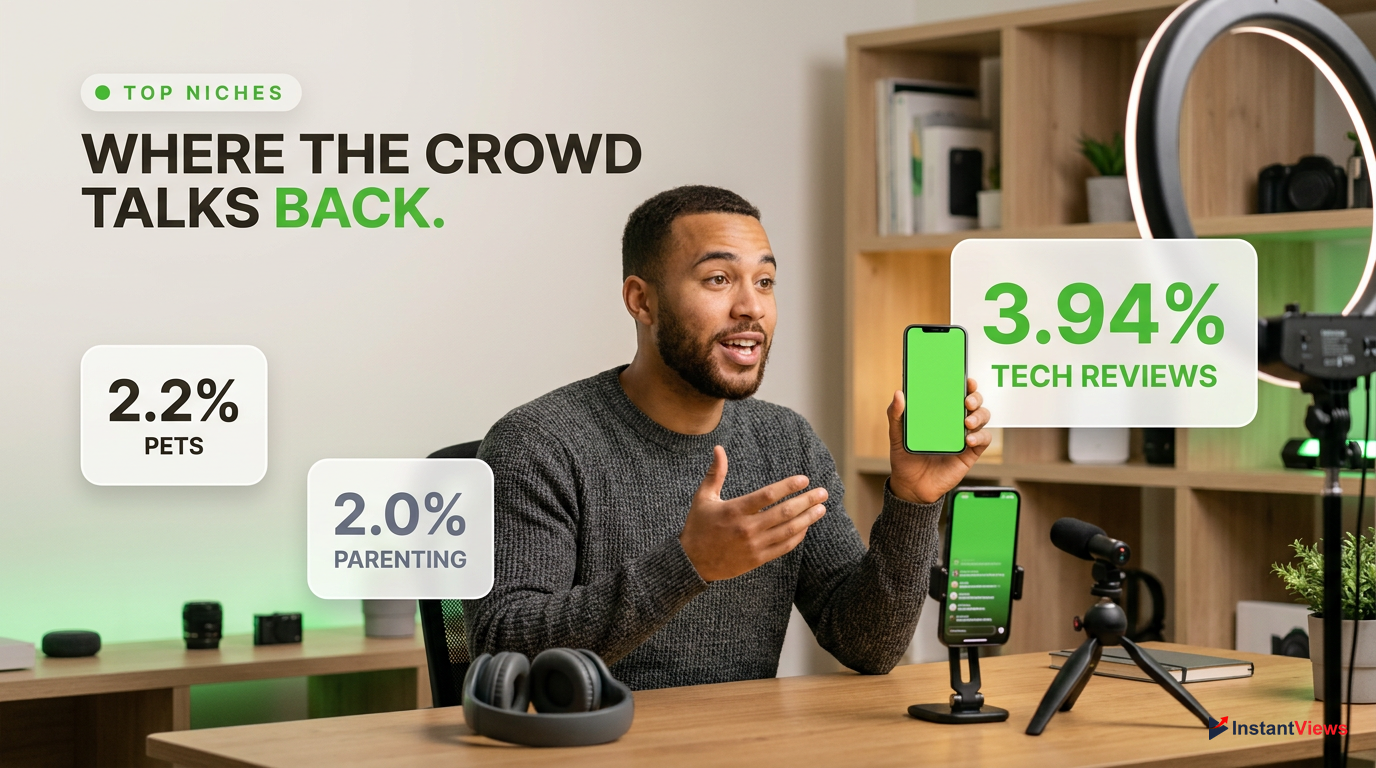
According to SociaVault Labs (2026), Tech Reviews are a standout high-performing niche, averaging an impressive 3.94%. This high rate is driven by viewers frequently asking specific questions about product specs, sharing their own opinions, or debating the merits of different devices in the comments.
Other niches that see solid, above-average engagement include Pets & Animals at 2.2% and Parenting at 2.0% (UseSnippet, 2026). These niches foster strong emotional connections and community sharing, driving consistent likes and comments.
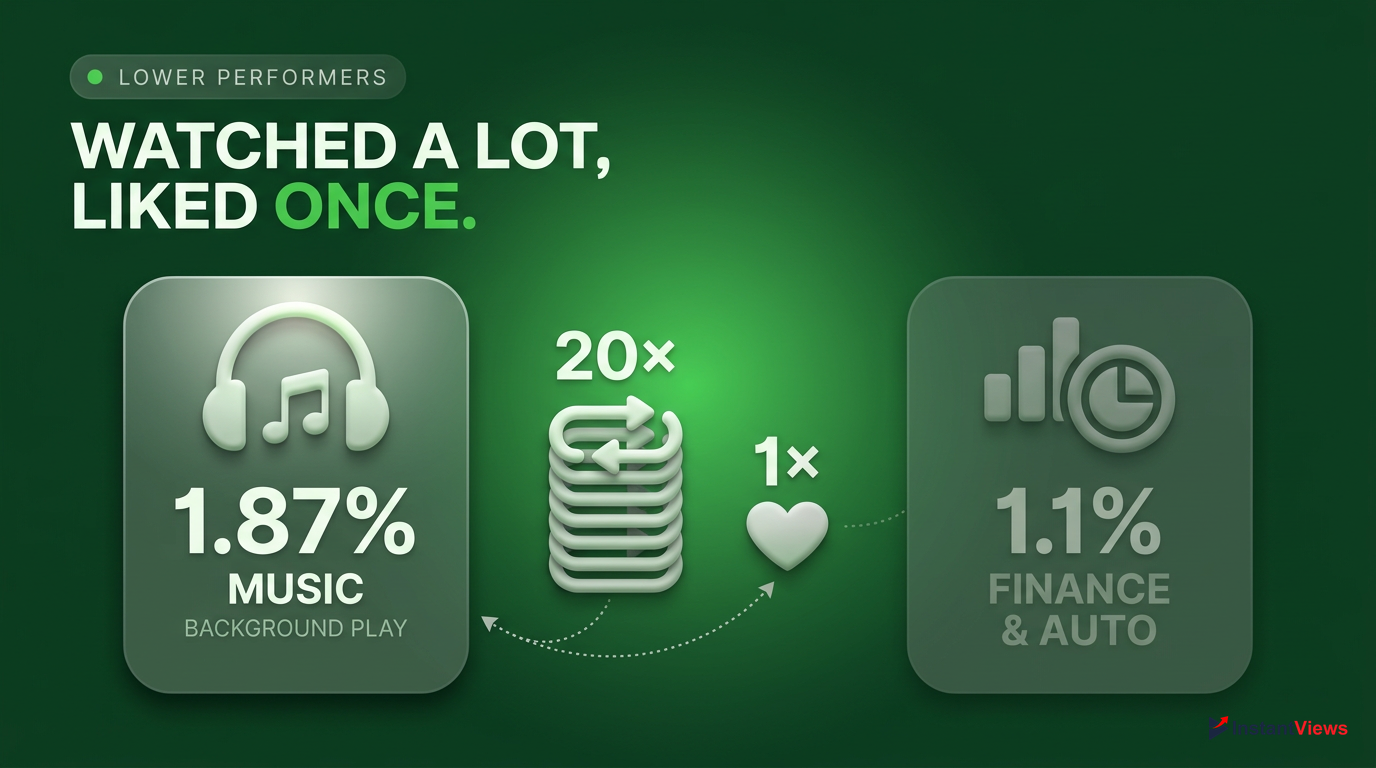
Engagement Rate by Content Niche: Lower Performers
Conversely, some niches inherently generate lower engagement rates, not necessarily because the content is poor, but because of how the audience consumes it. Understanding these nuances is vital when determining a good engagement rate on YouTube for your specific channel.
If you are in a lower-performing niche, do not panic if your engagement rate seems low compared to the overall platform average. Compare your metrics against your specific niche benchmarks.
The Music niche is a prime example, averaging just 1.87% (SociaVault Labs, 2026). Music videos often achieve massive view counts, but viewers use them for passive background listening. A user might watch a music video 20 times but will only "like" or comment on it once, severely diluting the view-based engagement rate.
Music
- Passive background listening
- High repeat views, low repeat interaction
Finance & Auto
- Information consumption
- Less community debate
Similarly, Finance & Automotive niches average around 1.1% (UseSnippet, 2026). Viewers in these niches are often seeking specific information or tutorials and are less likely to engage in community discussions once they have found the answer they need.
How to Find Your Engagement Metrics in YouTube Studio
To calculate your engagement rate, you need accurate data. YouTube Studio provides all the necessary metrics, but you have to know where to look to gather the inputs for the view-based formula.

Open YouTube Studio
Navigate to studio.youtube.com and log into your channel account.
Access Video Analytics
Click on 'Content' in the left-hand menu, hover over the specific video you want to analyze, and click the 'Analytics' (graph) icon.
Gather Your Metrics
On the 'Overview' tab, note your Total Views. Then, navigate to the 'Engagement' tab to find your total Likes and Shares. Finally, check the 'Comments' section for your total comment count.
Once you have gathered your Total Views, Likes, Comments, and Shares, plug them into the View-Based Formula: (Likes + Comments + Shares) / Total Views × 100. This will give you your exact engagement rate for that specific video.
While YouTube Studio provides a wealth of data, it does not automatically calculate your overall engagement rate percentage using the industry-standard formula. You must calculate this manually or use a third-party analytics tool.
Why Engagement Rate Matters for the 2026 Algorithm
Understanding what a good engagement rate on YouTube is isn't just about vanity metrics; it directly impacts how the platform distributes your content. The 2026 YouTube algorithm relies heavily on early engagement signals to determine a video's potential reach.
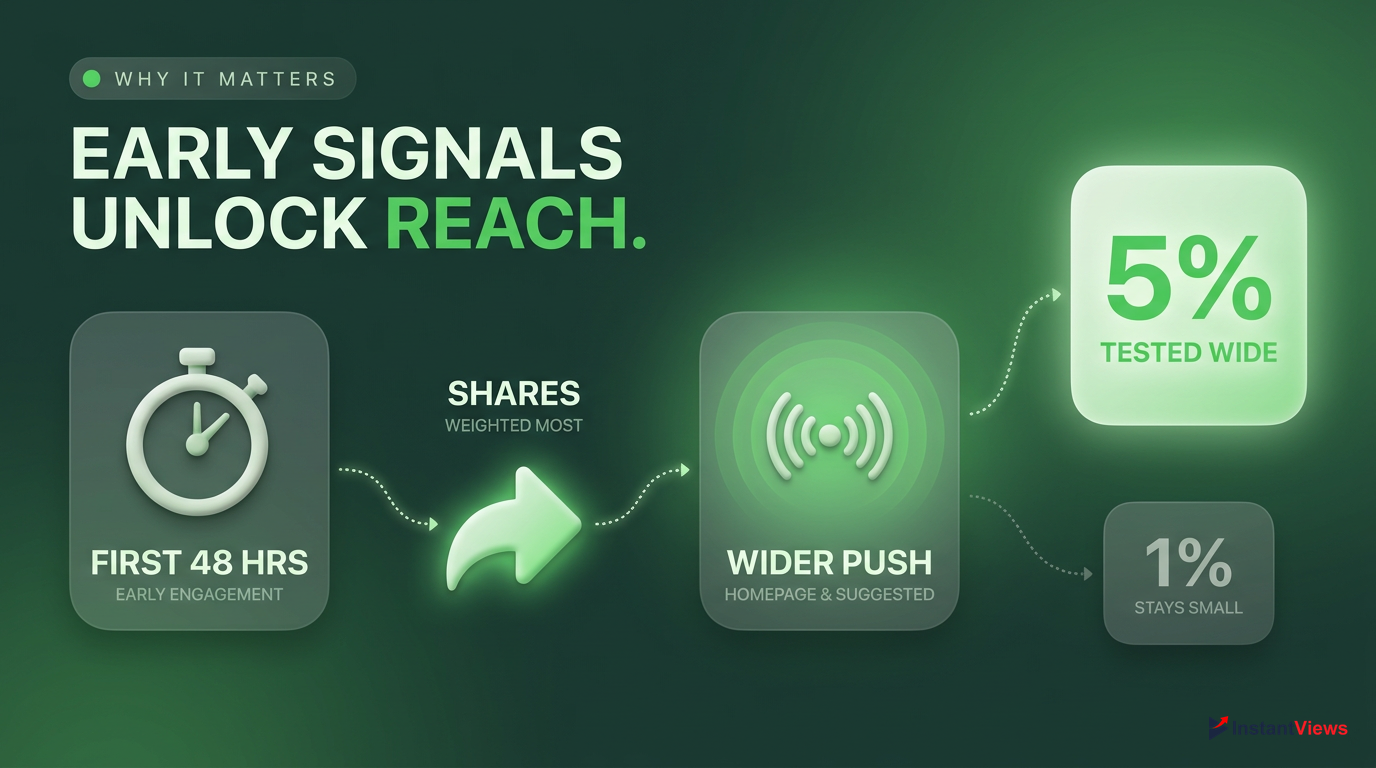
High engagement rates in the first 24-48 hours signal to the algorithm that a video is resonating, prompting it to push the content to a broader, non-subscriber audience via the Homepage and Suggested Videos.
While watch time and click-through rate (CTR) remain the most critical metrics for long-term success, engagement (likes, comments, shares) acts as an accelerant. A video with a 5% engagement rate will almost always be tested with a wider audience than a video with a 1% engagement rate, assuming watch time is comparable.
Shares are weighted heavily by the algorithm in 2026. A share indicates that a viewer found the content valuable enough to distribute to their own network, which YouTube interprets as a strong signal of quality.
Strategies to Improve Your YouTube Engagement Rate
If your calculations reveal that you do not currently have a good engagement rate on YouTube, there are actionable steps you can take to improve it. Moving from a "poor" (< 1%) to an "average" (3.06%) rate requires intentional community building.

- Ask specific, opinion-based questions in the video to prompt comments.
- Pin a thought-provoking comment to the top of the comment section.
- Use visual call-to-actions (CTAs) for likes and subscriptions, rather than just verbal ones.
- Reply to every comment within the first 24 hours of publishing.
- Create community posts to keep the audience engaged between video uploads.
One of the most effective strategies is to shift your CTAs. Instead of the generic "like and subscribe," ask a specific question related to the video's content. For example, in a tech review, ask: "Would you choose the iPhone or the Samsung based on these camera specs? Let me know below."
Hearting a comment sends a notification directly to the user. This simple action often brings them back to the video, increasing their connection to your channel and encouraging future engagement.
The Impact of Engagement Rate on Brand Sponsorships
For creators looking to monetize, a good engagement rate on YouTube is often more important than total subscriber count. Brands in 2026 are highly sophisticated; they know that a massive subscriber count means nothing if the audience isn't actively interacting with the content.
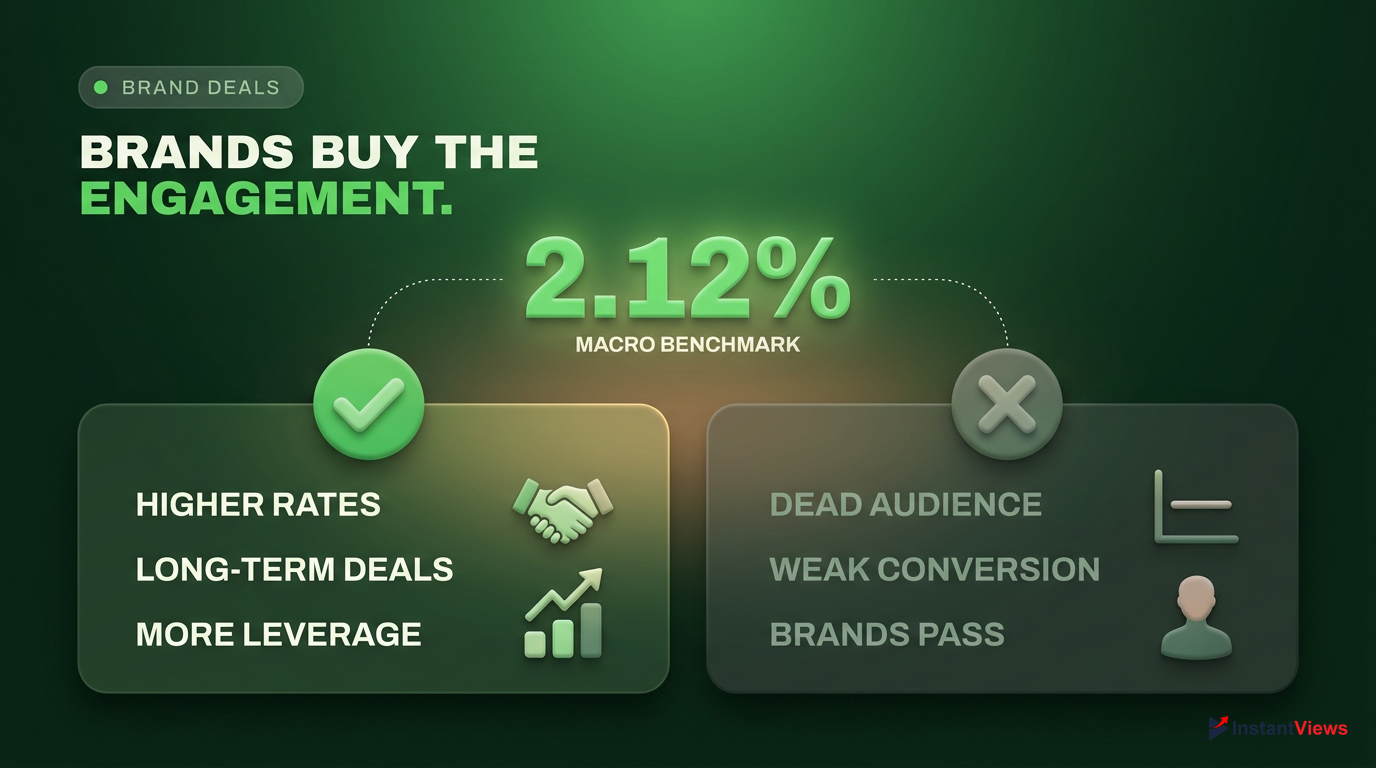
When brands evaluate Macro channels (100K–500K subs) for sponsorships, they are looking for that median 2.12% engagement rate (SociaVault Labs, 2026). If a channel has 300,000 subscribers but an engagement rate of 0.5%, brands will likely pass, assuming the audience is inactive or the views are inflated.
- Commands higher sponsorship rates (CPM/CPV).
- Attracts long-term brand partnerships.
- Provides leverage in negotiation.
- Brands may view the audience as "dead" or uninvested.
- Lower conversion rates for affiliate links.
- Difficulty securing premium sponsorships.
Ultimately, your engagement rate proves to a brand that you have influence, not just an audience. It demonstrates that when you speak, your viewers listen and react.
Frequently Asked Questions
The industry standard is the View-Based Formula: (Likes + Comments + Shares) / Total Views × 100. This accurately measures how many people who actually watched the video decided to interact with it, accounting for non-subscriber reach.
Based on a 2026 study of 75,000 channels, the overall median engagement rate across all of YouTube is approximately 3.06%. Rates between 1.5% and 3% are considered average.
Nano channels (1K–10K subs) have highly dedicated audiences. The median engagement rate for this tier is 5.23%. Anything over 7% for a Nano channel is considered excellent.
Yes. YouTube Shorts average between 3.4% and 8% engagement, compared to 2% to 4% for long-form videos. This is due to the high-velocity, swipe-based interaction model of the Shorts feed.
The Music niche averages a lower engagement rate (1.87%) because viewers use the content for passive background listening. They may watch a video multiple times but only interact with it once, diluting the percentage.
Brands targeting Macro channels (100K–500K subs) for sponsorships typically look for the median engagement rate of 2.12% or higher to ensure the audience is active and invested.
An engagement rate below 1% is generally considered poor. It suggests passive viewership where audiences watch the content but feel no connection or motivation to interact, like, or comment.
Engagement rates have an inverse relationship with subscriber count. Smaller channels (Nano/Micro) have higher engagement rates (3.7%-5.2%), while larger channels (Mega) reach broader audiences and see lower rates (1.41%).
According to 2026 data, Tech Reviews are a high-performing niche, averaging an impressive 3.94% engagement rate. This is driven by viewers asking questions about specs and debating product merits.
Improve engagement by asking specific, opinion-based questions in your videos, pinning thought-provoking comments, replying to all comments within 24 hours, and using visual call-to-actions to prompt likes and shares.