
- You only need a handful of core metrics — views, impressions and CTR, average view duration, audience retention, watch time, subscribers, traffic sources, and engagement
- Click-through rate measures whether your packaging earns the click; average view duration and retention measure whether the content holds attention
- In 2026 YouTube optimizes for viewer satisfaction and retention, so retention now matters more than raw accumulated watch time
- Always read a metric against its context — especially the traffic source, since a healthy home-feed CTR looks very different from a search CTR
- For beginners, prioritize retention and CTR first; views and subscribers are outcomes of getting those two right
Open YouTube Studio for the first time and the analytics screen can feel like an airplane cockpit — rows of numbers, graphs that rise and fall, and percentages with no obvious meaning. It is tempting to either ignore it all or fixate on the one number that goes up the most: views. Both reactions hold creators back.
The truth is that YouTube gives you an extraordinary amount of feedback about your content, and you only need to understand a small set of foundational metrics to use it well. With more than 2.7 billion monthly active users and over a billion hours of video watched every day, the platform is constantly measuring how audiences respond to your videos. Learning to read those signals is the difference between guessing and improving on purpose.
This guide walks through the core metrics every creator must understand: what each one actually measures, what a healthy result looks like in plain language, and — most importantly — which ones to prioritize when you are starting out. We will keep it foundational and beginner-friendly. No advanced dashboards, no obscure ratios — just the numbers that genuinely matter and how to make sense of them in 2026.
- Why Analytics Matter (And What to Ignore)
- The Core Metrics at a Glance
- Views: The Number Everyone Watches
- Impressions and Click-Through Rate
- Average View Duration and Audience Retention
- Watch Time vs Retention
- Subscribers and Subs Per Video
- Traffic Sources: How People Find You
- Engagement: Likes, Comments, and Shares
- Which Metrics to Prioritize
- FAQ
Why Analytics Matter (And What to Ignore)
Analytics exist to answer one question: is this working, and if not, why? Every video you publish is an experiment. The thumbnail is a hypothesis about what will make someone click. The first thirty seconds are a hypothesis about what will make them stay. Analytics tell you whether those hypotheses were right.
Without them, you are flying blind — producing video after video with no idea which choices helped and which hurt. With them, every upload teaches you something you can apply to the next one. That feedback loop is the single most powerful growth tool a creator has, and it costs nothing.
But not every number deserves your attention. Beginners often obsess over vanity metrics — total views, the subscriber count ticking up — while ignoring the diagnostic metrics that actually explain performance. A video can rack up views from one lucky recommendation and still be teaching you nothing useful. The skill is knowing which numbers describe what happened and which numbers explain why.

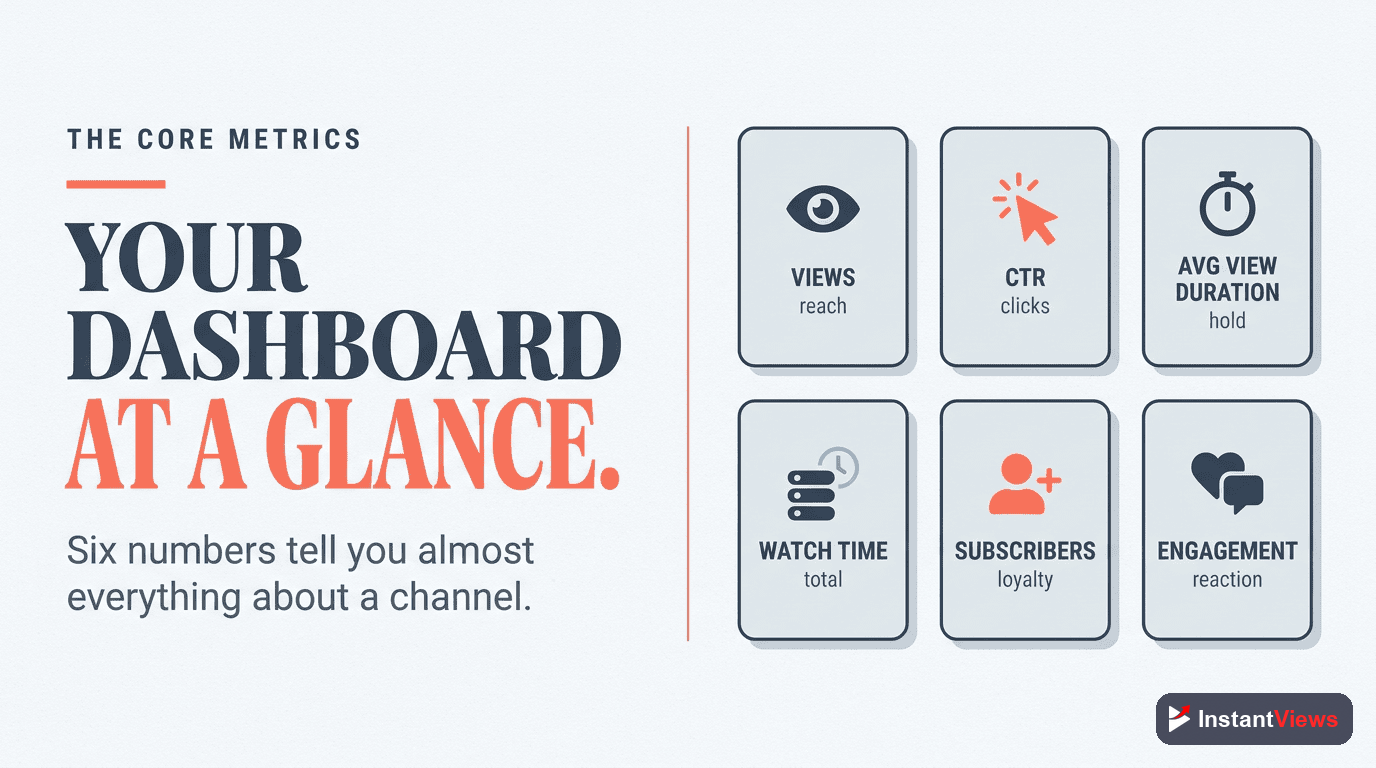
The Core Metrics at a Glance
Before we go deep on each metric, here is the full set in one place. Bookmark this table — it is the foundation everything else builds on.
| Metric | What It Measures | Why It Matters |
|---|---|---|
| Views | How many times your video was watched | The top-line reach number, but the least diagnostic on its own |
| Impressions | How many times your thumbnail was shown to people | Shows how much YouTube is offering your video to audiences |
| Click-Through Rate (CTR) | The share of impressions that became clicks | Tells you whether your title and thumbnail earn the click |
| Average View Duration | Average minutes a viewer watches before leaving | Shows how engaging the video is, in absolute time |
| Audience Retention | The percentage of the video viewers watch, and where they drop | The clearest signal of whether content holds attention |
| Watch Time | Total minutes everyone watched, added together | Reflects overall consumption and feeds long-term reach |
| Subscribers | People who opted in, plus subs gained per video | A trust signal and a measure of which topics create fans |
| Traffic Sources | Where viewers found the video | Explains how discovery is happening so you can read other metrics correctly |
| Engagement | Likes, comments, and shares | Signals how strongly the video resonates with the people who watch |
Views: The Number Everyone Watches
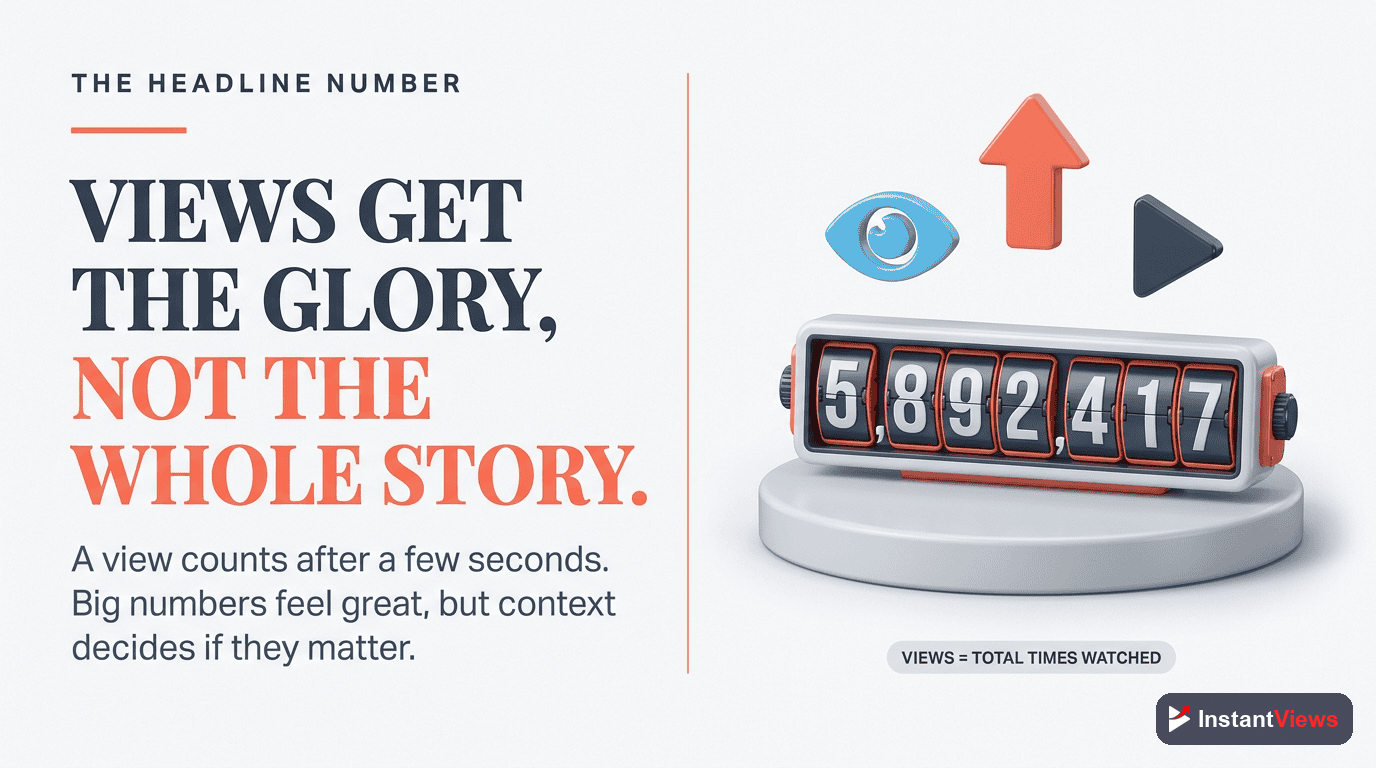
Views are the metric everyone understands and the one creators check first. A view is counted when someone watches your video, and it is the headline number of reach — how many times your content was actually consumed.
Here is the catch: views are the least diagnostic metric on this list. A high view count tells you that a lot of people watched, but not why they watched, whether they stayed, or whether they will come back. A single video can go semi-viral off one strong recommendation and leave you with a spike that teaches you almost nothing repeatable.
That does not make views worthless. They are the ultimate scoreboard of reach, and tracking how view counts trend over weeks and months shows whether your channel is growing. The mistake is treating views as the cause of success rather than the result of getting the other metrics right. Views are an outcome. Read them, but do not optimize for them directly.
Impressions and Click-Through Rate
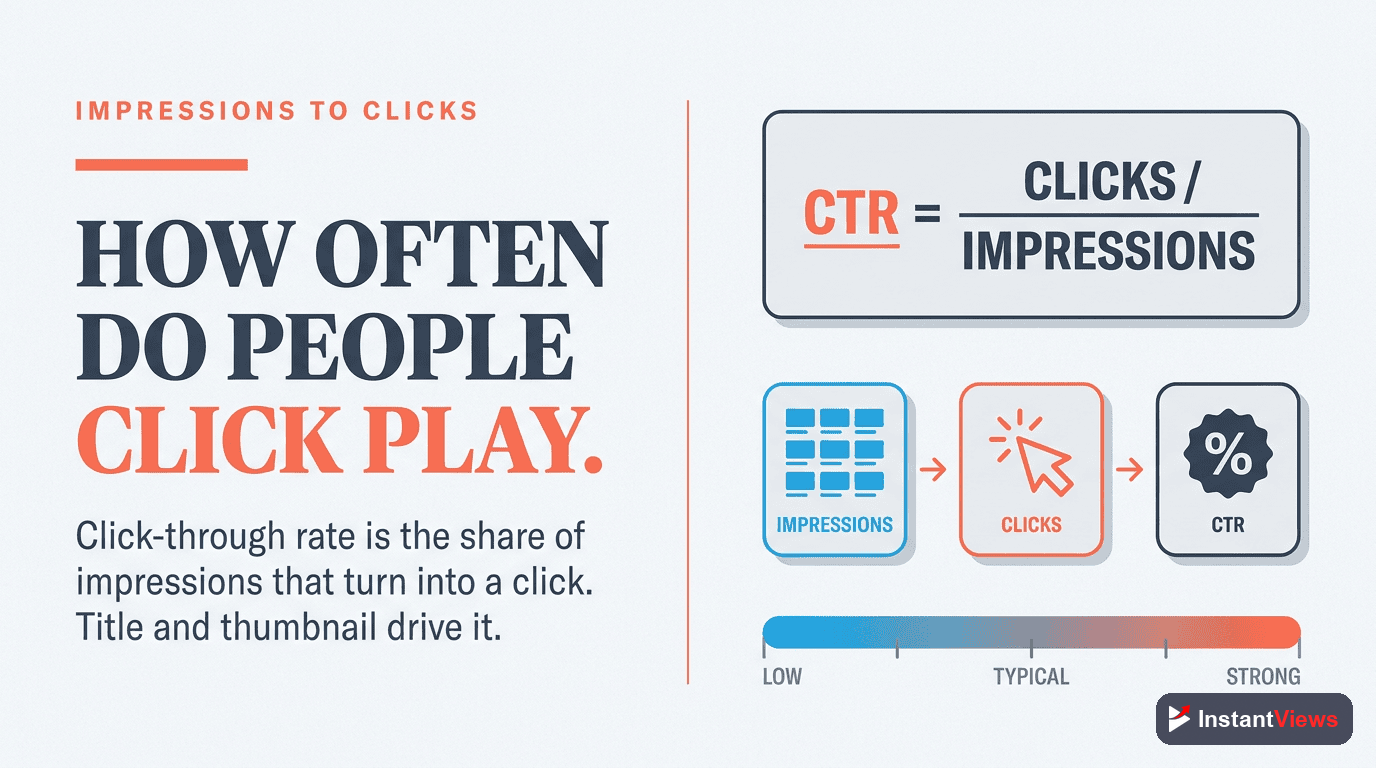
These two metrics are best understood together because one depends on the other. An impression is counted each time YouTube shows your thumbnail to a viewer — on the home feed, in search results, or in suggested videos. Click-through rate (CTR) is the percentage of those impressions that turned into a click.
If your thumbnail was shown 1,000 times and 50 people clicked, your CTR is 5%. That single number tells you how well your title and thumbnail — your "packaging" — are doing their one job: convincing someone to choose your video over everything else competing for their attention.
What Is a Healthy CTR?
For most established channels, a CTR between 4% and 6% is healthy, and anything above 6% is strong. Roughly half of all channels sit somewhere between 2% and 10%. But the single most important thing to understand about CTR is that it depends heavily on the traffic source:
- Search traffic tends to earn the highest CTR, because those viewers are actively looking for what you made.
- The home feed (browse) is the coldest traffic source — YouTube is showing your video to people who were not looking for it — so a CTR of 3% to 4% there is perfectly normal, not a sign of failure.
A common beginner mistake is panicking over a 4% CTR without checking that most of those impressions came from the home feed, where 4% is genuinely fine.
A high CTR with very low early retention is now a red flag, not a win. In 2026 YouTube evaluates clicks alongside what happens after them — if a thumbnail earns lots of clicks but viewers leave in the first 15 to 30 seconds, the algorithm reads it as an overpromising title and reduces how often the video is recommended.
Average View Duration and Audience Retention
If CTR decides whether people click, these two metrics decide whether the click was worth it. They are closely related but answer slightly different questions.
Average View Duration (AVD)
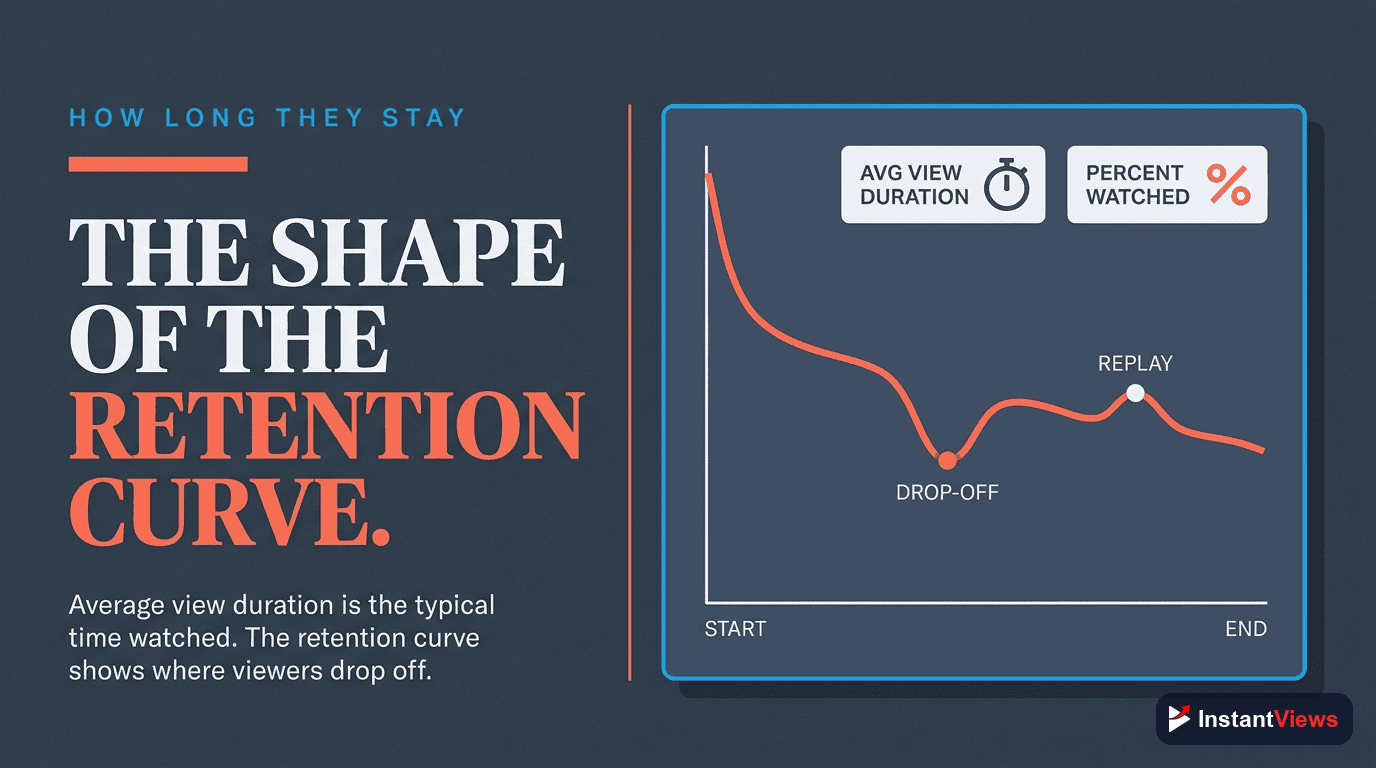
Average view duration is the average amount of time a viewer spends watching before they leave, expressed in minutes and seconds. If a 10-minute video has an AVD of 4 minutes, the average viewer watches 40% of it. AVD is useful because it is an absolute number — real minutes of attention you earned.
Audience Retention
Audience retention takes the same idea and turns it into a percentage and a curve. The retention graph shows what share of viewers are still watching at every moment of the video, so you can see exactly where people drop off. A sharp dip in the first thirty seconds means your hook is failing. A gentle, gradual decline is the healthy shape you want.
For many tutorial and how-to videos, a retention of roughly 45% to 55% is considered healthy, though this varies a lot by format and length. The shape of the curve often matters more than the headline percentage. One nuance worth knowing in 2026: YouTube increasingly treats "good abandonment" kindly — if a viewer gets the exact answer they came for and leaves satisfied, that is no longer punished the way an early, frustrated exit is.
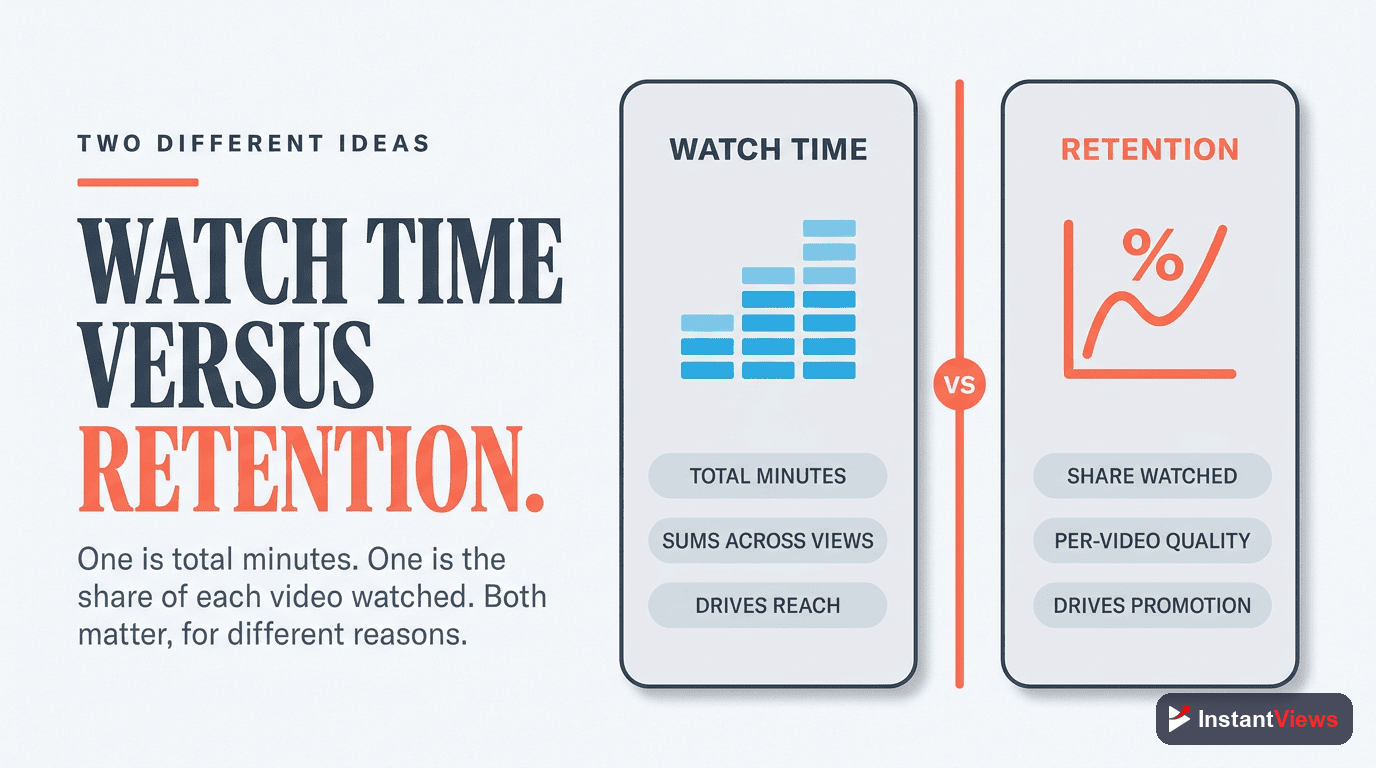
Watch Time vs Retention
These two get confused constantly, so it is worth pinning down the difference clearly.
Watch time is the total number of minutes everyone has watched, added together across all views. Ten people watching five minutes each gives you fifty minutes of watch time. It is a cumulative number that grows as more people watch, and it has historically been one of the headline signals YouTube cares about because it reflects how much total attention your content commands.
Audience retention, by contrast, is about quality, not quantity — what percentage of each video people actually watch, regardless of how many people show up. A video can have modest watch time but excellent retention, or huge watch time and poor retention.
So which matters more? In 2026 the answer has shifted clearly toward retention. YouTube now optimizes for viewer satisfaction and how well you hold attention rather than raw accumulated minutes. A short, tight video that people watch to the end can outperform a long one that they abandon, because retention is the cleaner signal that the content was genuinely worth their time. Watch time still matters as a reflection of consumption, but if you have to choose where to focus, choose retention.
"Views tell you how many people showed up. Retention tells you whether the video deserved them. In 2026, YouTube rewards the second number far more than the first."
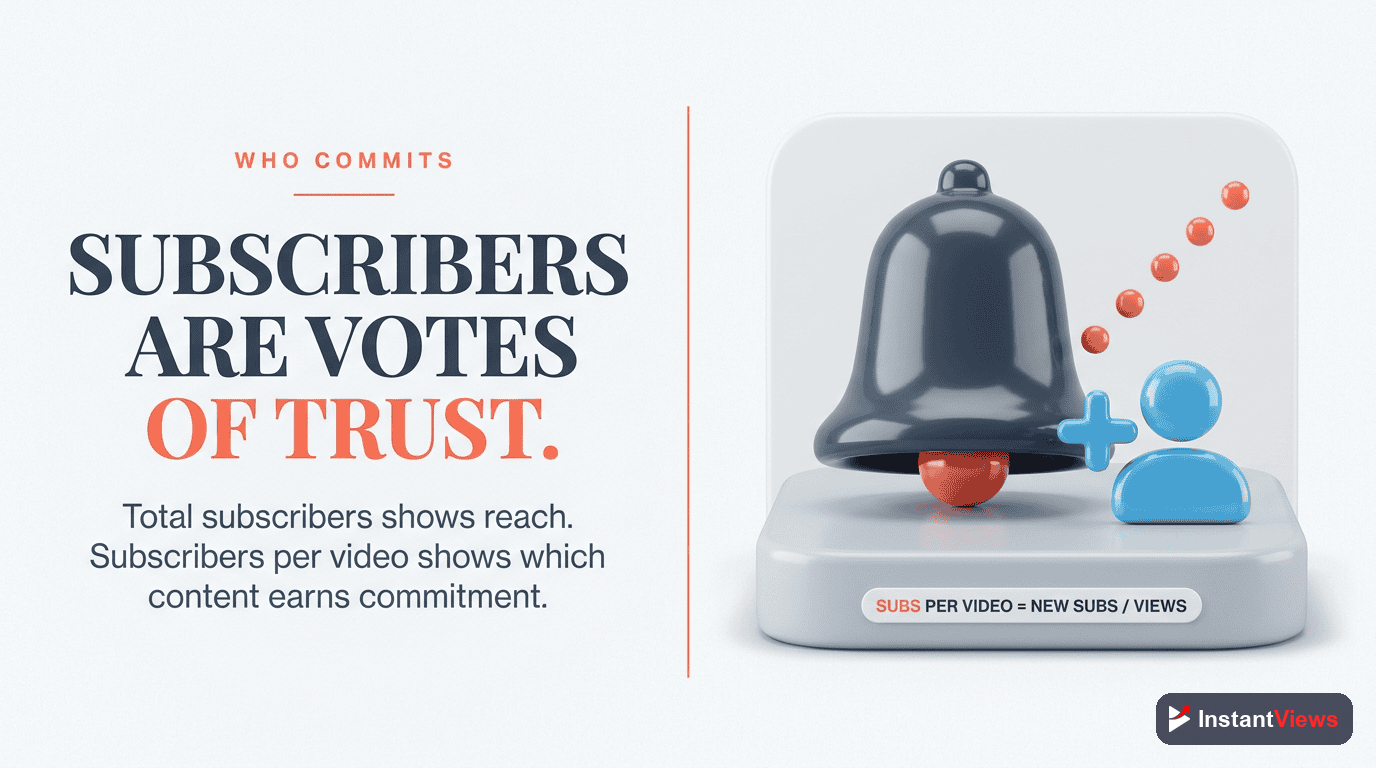
Subscribers and Subs Per Video
The subscriber count is the metric creators are most emotionally attached to, and it does mean something — but probably not what beginners assume. Subscribers are people who opted in to see more of your content, which makes the number a useful trust signal: it shows how many viewers liked you enough to want more.
The more actionable view, though, is subscribers gained per video. YouTube Analytics shows you how many subscribers each individual upload earned. This is gold, because it tells you exactly which topics, formats, and styles turn casual viewers into committed fans. A video with average views but a high subscriber gain is doing something special — make more like it.
One important reality check: subscribers no longer drive reach the way many people believe. The algorithm leans far more on retention and CTR than on your subscriber count when deciding who to show a video to. A large subscriber base helps, but a video still has to earn its recommendations on the strength of how it performs. Treat subscriber growth as a healthy outcome of good content, not as the lever you pull directly.
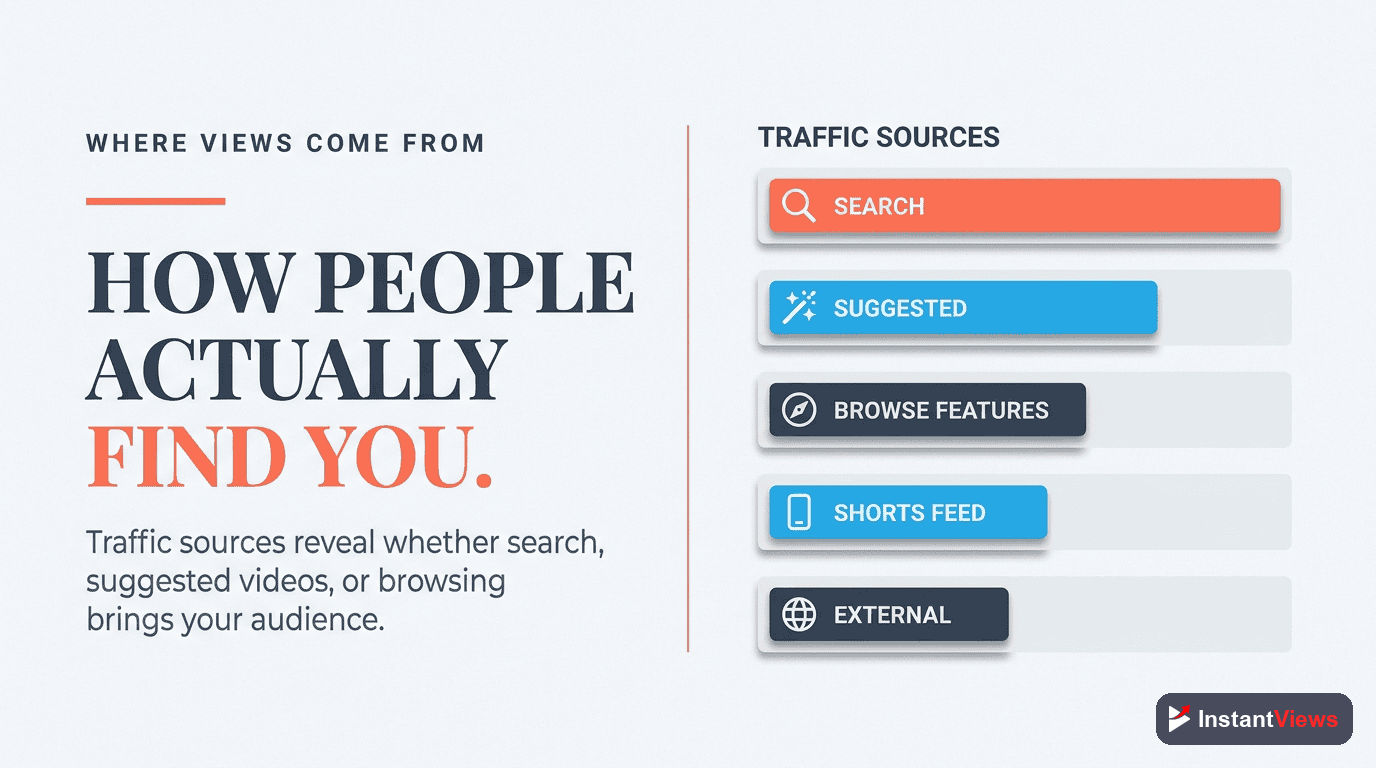
Traffic Sources: How People Find You
Traffic sources are the metric that makes every other metric readable, which is why so many experienced creators check it first. It shows how viewers found each video. The main sources you will see are:
- YouTube Search: viewers who typed a query and found you — warm, intent-driven traffic.
- Suggested videos: your video recommended alongside or after another video.
- Browse features (home feed): the home page and subscription feed — the coldest, broadest source.
- Shorts feed: discovery through the vertical Shorts experience.
- External: traffic from outside YouTube, like a website, newsletter, or social post.
- Playlists and channel pages: viewers moving through your own catalog.
Why does this matter so much? Because a "good" number depends entirely on the source. A high search percentage means your titles and descriptions are winning discovery. A heavy reliance on suggested and browse means the algorithm is actively pushing you. And as we saw with CTR, the same percentage means very different things depending on whether it came from search or the home feed. Read your traffic mix first, then interpret everything else through it.
Engagement: Likes, Comments, and Shares
Engagement is the cluster of actions viewers take beyond simply watching: likes, comments, and shares. On their own, none of these is a make-or-break metric, but together they paint a picture of how strongly your content resonates with the people who actually watch it.
- Likes are a quick, low-effort signal of approval — useful as a rough resonance gauge.
- Comments are higher-effort and far more revealing. They tell you what landed, what confused people, and what to make next. A healthy comment section is also a strong sign of community.
- Shares are the most valuable engagement of all, because a share means someone thought your video was worth putting their own reputation behind. Shares actively expand your reach beyond YouTube.
Use engagement qualitatively rather than chasing a target number. If a video earns unusually high comments or shares relative to its views, it struck a nerve — study why and repeat it. If engagement is flat despite decent views, the content may be fine but forgettable, which is a signal to raise the stakes or sharpen your point of view.

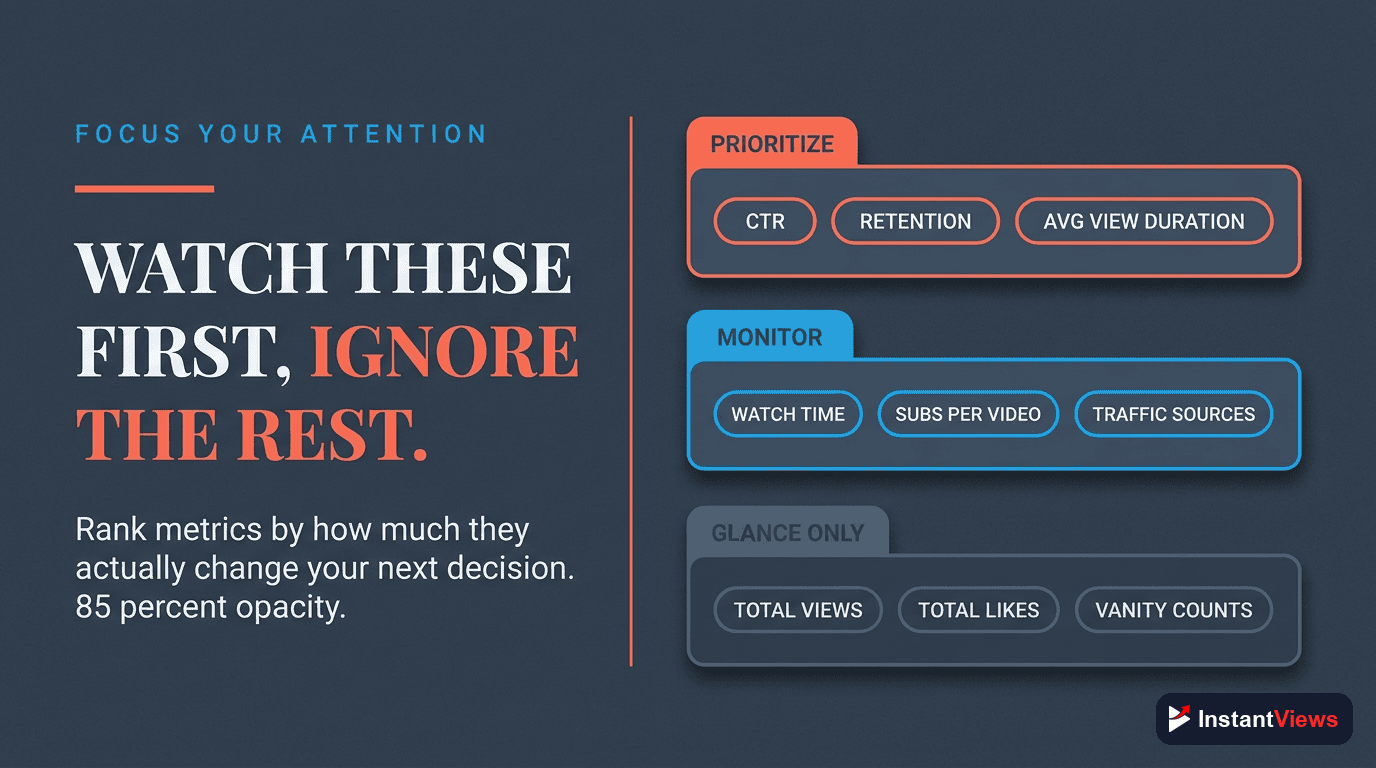
Which Metrics to Prioritize
You now know the full set, but knowing them is not the same as knowing where to spend your limited attention. Here is the priority order that serves almost every beginner well, framed as a simple weekly routine.
Read Your Traffic Sources First
Before judging any number, see where your viewers came from. This single step prevents the most common analytics mistake — misreading a healthy home-feed CTR as a failure or a great search CTR as ordinary.
Check Audience Retention
Open the retention curve and find the biggest drop-off. Because YouTube optimizes for retention in 2026, this is the metric with the most leverage over your reach. Fix where people leave, and almost everything else improves.
Check Click-Through Rate
Compare your CTR against the right benchmark for its traffic source. If retention is strong but CTR is weak, your content is good and your packaging is holding you back — rework the title and thumbnail.
Scan Subscribers Per Video and Engagement
Note which videos earned the most subscribers and the strongest comments or shares. These reveal the topics that build real fans, so you can make more of what your audience clearly wants.
Change One Thing, Then Compare
Pick the single weakest metric, adjust one element on your next upload, and check whether it moved. One deliberate change per video teaches you more than overhauling everything at once.
If you boil all of this down to a single sentence, it is this: prioritize retention and CTR. Retention proves the content is worth watching; CTR proves the packaging is worth clicking. Views, watch time, and subscribers are the rewards you collect when those two are working. Beginners who internalize that order stop chasing vanity numbers and start making decisions that compound.
Put Your Analytics to Work
Explore our free suite of YouTube tools to research topics, sharpen your titles, and analyze what is driving your views and retention.
Explore Free YouTube Tools →"The creators who grow fastest are not the ones who check analytics most often — they are the ones who read the right two numbers, change one thing, and watch what happens next."
Frequently Asked Questions
The metrics that most directly influence your reach are click-through rate, average view duration, audience retention, and watch time. For beginners, the two to prioritize first are audience retention and click-through rate, because they tell you whether your content keeps people watching and whether your packaging earns the click.
For most established channels a CTR between 4% and 6% is healthy, and anything above 6% is strong. About half of all channels sit between 2% and 10%. CTR also varies by traffic source — search traffic often earns a much higher CTR than the home feed, where 3% to 4% is perfectly normal because that audience is colder.
Watch time is the total number of minutes everyone has spent watching a video or channel added together. Average view duration is the average minutes a single viewer watches before leaving. Watch time grows with more views, while average view duration reflects how engaging the video itself is regardless of how many people see it.
In 2026 YouTube optimizes for viewer satisfaction and retention, so how well you hold attention matters more than raw accumulated watch time. A short video with excellent retention can outperform a longer one that people abandon early, because retention is the clearest signal that viewers found the content worthwhile.
It depends on format, but for many tutorial and how-to videos a retention of roughly 45% to 55% is considered healthy. The shape of the curve matters as much as the number: a strong opening, no sharp early drop-off, and a gradual decline are all good signs.
Traffic sources show how viewers found your video — YouTube search, suggested videos, the home feed (browse), Shorts feed, external sites, playlists, and channel pages. Knowing your mix helps you understand whether you are winning discovery through search, recommendations, or your existing audience.
A light weekly review is enough for most creators, with a closer look in the first 48 hours after publishing when early signals are strongest. Avoid checking obsessively in the first hours, since data is still settling and reacting to noise leads to bad decisions.
Subscribers are a useful trust signal and the per-video subscriber count tells you which topics convert casual viewers into fans. However, subscribers alone do not drive reach; the algorithm leans more on retention and CTR. Treat subscriber growth as an outcome of good content rather than the primary target.
Conclusion
YouTube Analytics can feel overwhelming because there are dozens of numbers competing for your attention. The good news is that you do not need all of them. A handful of foundational metrics — views, impressions and CTR, average view duration, audience retention, watch time, subscribers, traffic sources, and engagement — tell you almost everything about how your content is really performing.
If you remember nothing else, remember this hierarchy: retention and CTR come first. Retention proves your content is worth watching, and CTR proves your packaging is worth clicking. In 2026 YouTube openly optimizes for viewer satisfaction and retention, which means a video that genuinely holds attention will travel further than one that simply accumulates raw watch time. Get those two right and the rest — views, subscribers, and watch time — tend to follow.
Start small. Open your analytics this week, read just these core metrics for your last few uploads, and find the single weakest link. Change one thing on your next video, then check whether the number moved. Do that consistently and analytics stops being a wall of intimidating charts and becomes the clearest feedback loop you have for growing your channel.


