- Retention analytics reveal exactly when and why viewers leave your videos
- The first 30 seconds are critical - 80%+ retention in this window is essential
- Relative retention shows how your video performs compared to similar content on YouTube
- Different niches have different retention benchmarks - know your standards
- Use InstantViews Video Analyzer to predict retention issues before publishing
YouTube retention analytics is the most powerful tool in your creator arsenal. While views and subscribers get all the attention, retention data tells you the truth about your content quality.
The harsh reality? Most creators are guessing. They upload videos, hope for the best, and wonder why they're not growing. Meanwhile, successful creators are obsessed with retention graphs - they know exactly where viewers drop off and why.
This guide will transform how you understand viewer behavior. You'll learn to read retention graphs like a data scientist, identify problems before they kill your videos, and use retention insights to create content that keeps viewers watching until the end.
Understanding Retention Graphs
Your retention graph is a visual representation of viewer behavior over time. The X-axis shows video progress (time or percentage), and the Y-axis shows the percentage of viewers still watching.
Every retention graph tells a story. Here's how to read it:
Anatomy of a Retention Curve
A typical retention curve has three distinct phases:
- The Hook (0-30 seconds) - The steepest drop-off point. Expect to lose 20-40% of viewers here
- The Middle (30s to 80%) - A gradual decline where content quality determines retention
- The Ending (80-100%) - Often sees another drop as viewers achieve their goal and leave
The Ideal Curve
A healthy retention graph shows a sharp initial drop (0-15 seconds), then a gentle, steady decline throughout the middle, with 40-50% of viewers reaching the end.
Your hook is strong enough to filter casual browsers but retain interested viewers. Your content delivers on the promise from your title/thumbnail. Pacing keeps viewers engaged throughout.
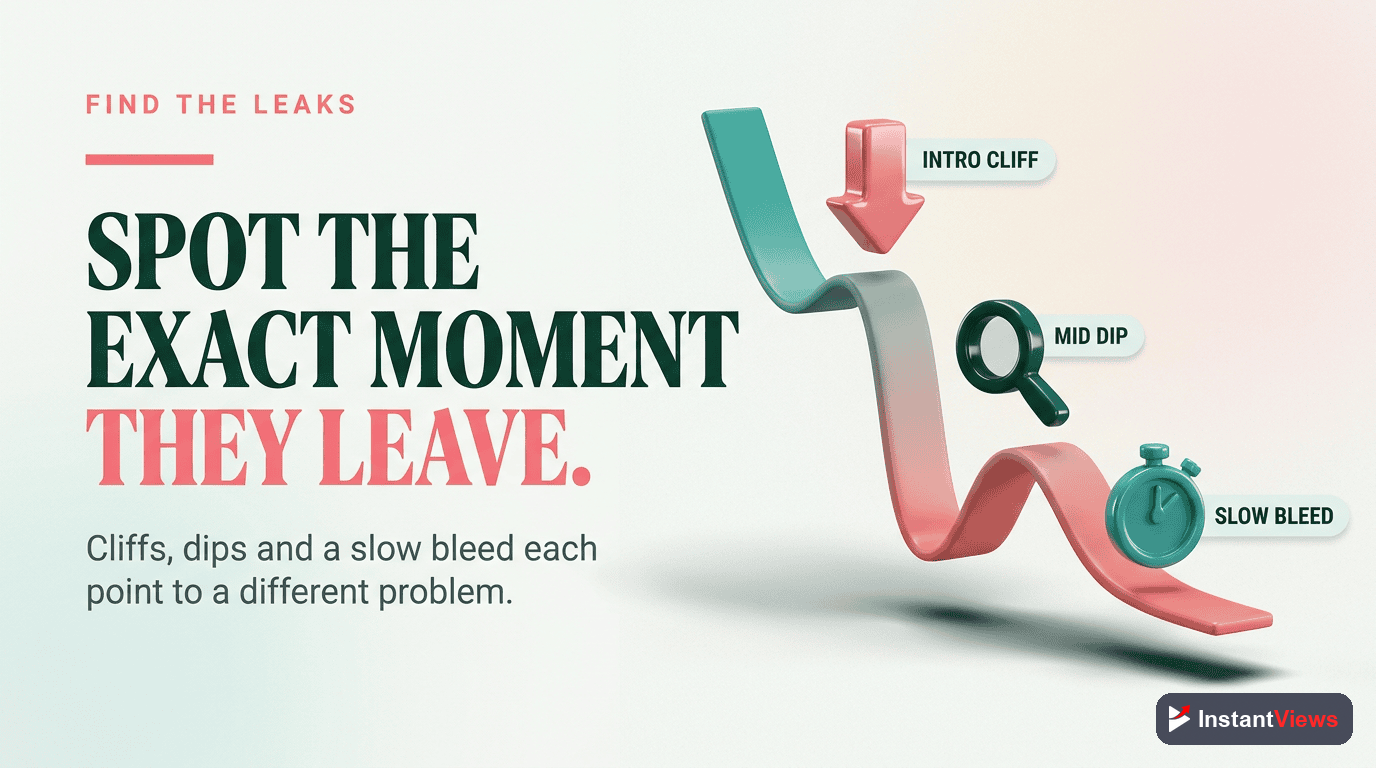
The Cliff Drop
A massive drop at a specific timestamp (e.g., from 70% to 30% in 10 seconds) indicates a critical problem at that exact moment.
You delivered the main answer (viewers got what they came for), introduced a long sponsor segment, had technical issues (audio cut out, video froze), or the content took an unexpected turn that disappointed viewers.
The Gradual Exodus
A steep, continuous decline from start to finish with almost no one reaching the end signals fundamental content issues.
Title/thumbnail promised something the video doesn't deliver, content is too slow or repetitive, video is too long for the value provided, or there's a mismatch between thumbnail appeal and actual content quality.

Types of Retention Metrics
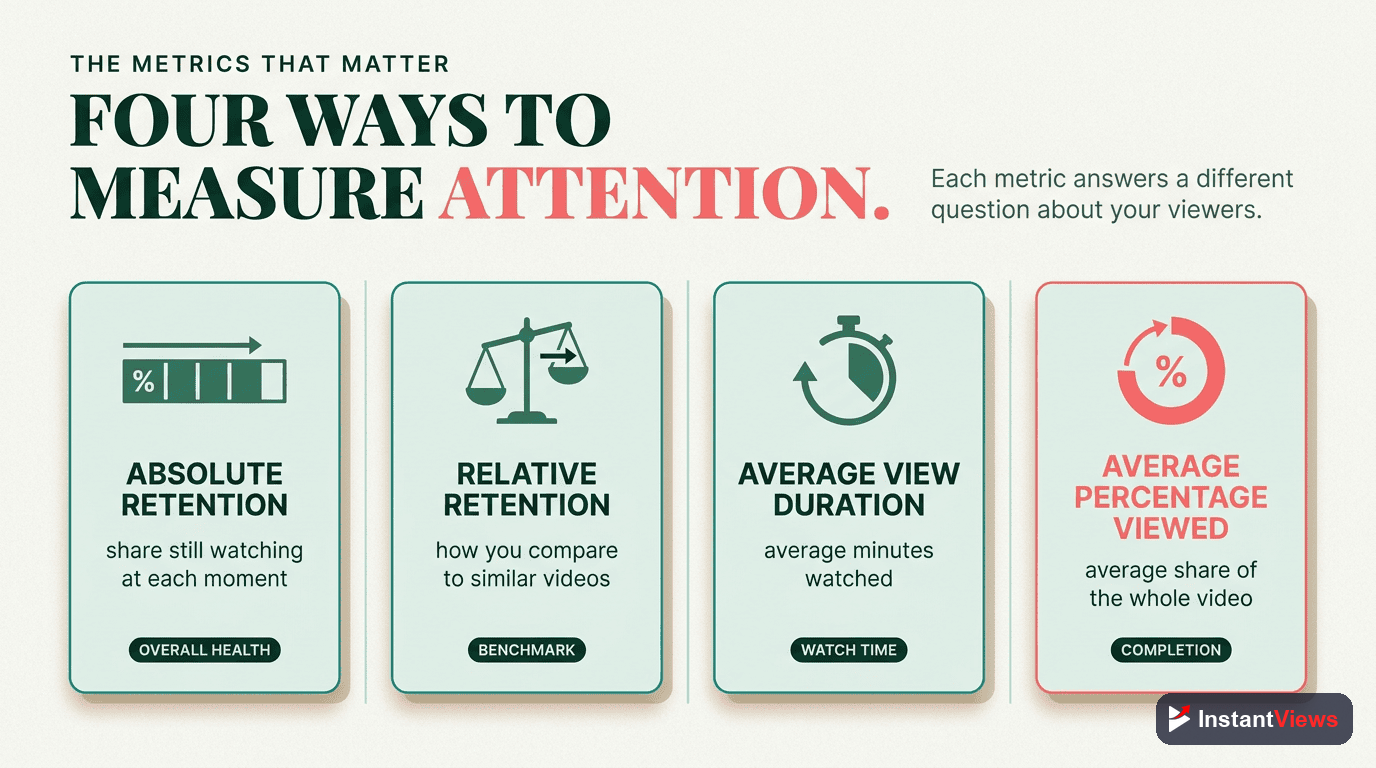
YouTube provides two types of retention data, and understanding both is crucial:
1. Absolute Audience Retention
Shows the exact percentage of viewers watching at each moment. This is the raw data - if 1,000 people clicked your video and 500 are still watching at the 5-minute mark, you have 50% absolute retention.
Use absolute retention to:
- Identify your hook effectiveness (first 30 seconds)
- Find specific drop-off points in your content
- Calculate average view duration
- Determine if your video is too long
2. Relative Audience Retention
Compares your video to all other YouTube videos of similar length. A graph above the baseline means you're performing better than average; below means worse.
Use relative retention to:
- Understand if your content is competitive
- Identify whether your retention issues are normal or problematic
- Benchmark against similar creators
- Predict YouTube's promotion potential
YouTube's algorithm heavily weights relative retention. A video with 35% absolute retention but high relative retention will get promoted more than a video with 45% absolute but low relative retention.
Understanding the Baseline
The relative retention graph shows a dotted baseline representing average YouTube performance. Here's what positions mean:
| Position vs Baseline | Performance Level | Algorithm Impact |
|---|---|---|
| Significantly Above | Exceptional - Top 10% | Maximum promotion, suggested videos, browse features |
| Above Baseline | Above Average - Top 30% | Strong promotion to relevant audiences |
| At Baseline | Average - Middle 40% | Standard promotion to existing audience |
| Below Baseline | Below Average - Bottom 30% | Limited promotion beyond subscribers |
| Significantly Below | Poor - Bottom 10% | Minimal promotion, may hurt channel authority |
Identifying Drop-Off Points
Drop-off analysis is where retention becomes actionable. Every dip in your graph is feedback - you just need to decode it.
The Critical First 30 Seconds
This is your make-or-break moment. Here's what healthy first-30-second retention looks like:
- Tutorial/Educational: 75-85% retention at 30 seconds
- Entertainment/Commentary: 70-80% retention
- Vlogs: 60-75% retention
- Long-form (30+ min): 65-75% retention
If you're below these benchmarks, your problem is in one of three areas:
Thumbnail/Title Mismatch
Viewers clicked expecting one thing but got something different. The first 5 seconds didn't confirm what your thumbnail promised.
Start with the exact visual or statement from your thumbnail. If your thumbnail shows a dramatic moment, start with that moment. If it promises "5 mistakes," say "Here are 5 critical mistakes" in the first breath.
Slow Hook
You're taking too long to establish value. Viewers don't know why they should stay.
Cut everything before the actual content starts. No long intros, animations, or "Hey guys welcome back." Start with your core value proposition within 3 seconds. See our guide on YouTube hooks that keep viewers watching.
Low Production Quality
Audio issues, poor lighting, or amateur presentation in the first moments causes immediate exits.
Invest in basic audio quality first (good mic), then lighting, then camera. Viewers will tolerate lower video quality if audio is clean and content is strong.
Mid-Video Drop-Offs
When you see a sudden drop between 30% and 80% of the video, you've hit a specific problem moment. Here's how to diagnose:
- Watch that exact timestamp - Note what happens in the 10 seconds before the drop
- Check for pacing changes - Did you slow down? Start rambling? Introduce a tangent?
- Look for value delivery - Did you give away the answer viewers came for?
- Identify pattern breaks - Did music stop? Scene change? Topic shift?
Retention Benchmarks by Niche
Different content types have vastly different retention expectations. Here's what you should be targeting:
| Content Type | Average Retention | Good Retention | Excellent Retention |
|---|---|---|---|
| Tutorial/How-To (5-10 min) | 40-50% | 50-60% | 60-70%+ |
| Educational/Explainer | 35-45% | 45-55% | 55-65%+ |
| Product Reviews | 30-40% | 40-50% | 50-60%+ |
| Gaming (Let's Play) | 25-35% | 35-45% | 45-55%+ |
| Commentary/Essay | 35-45% | 45-55% | 55-65%+ |
| Vlogs/Lifestyle | 25-35% | 35-45% | 45-55%+ |
| Long-form (30-60 min) | 20-30% | 30-40% | 40-50%+ |
| Podcast/Interview | 25-35% | 35-45% | 45-55%+ |
| Music Videos | 60-70% | 70-80% | 80-90%+ |
| Shorts (60 seconds) | 70-80% | 80-90% | 90-100% |
These benchmarks assume organic traffic. If you're buying views or using heavy external promotion, retention will typically be 10-20% lower. Always compare against your own channel's baseline performance.
Why Benchmarks Vary by Niche
The variation comes down to viewer intent:
- Tutorials have high retention because viewers came to solve a specific problem and need the full video
- Vlogs have lower retention because viewers browse casually and leave when interest fades
- Music videos have highest retention because people want to hear the full song
- Long-form has lower percentage retention but higher total watch time, which YouTube values
Predict Your Retention Before Publishing
Don't wait for bad retention data. Use our Video Analyzer to identify drop-off risks and get AI-powered recommendations to maximize watch time.
Analyze Your Video →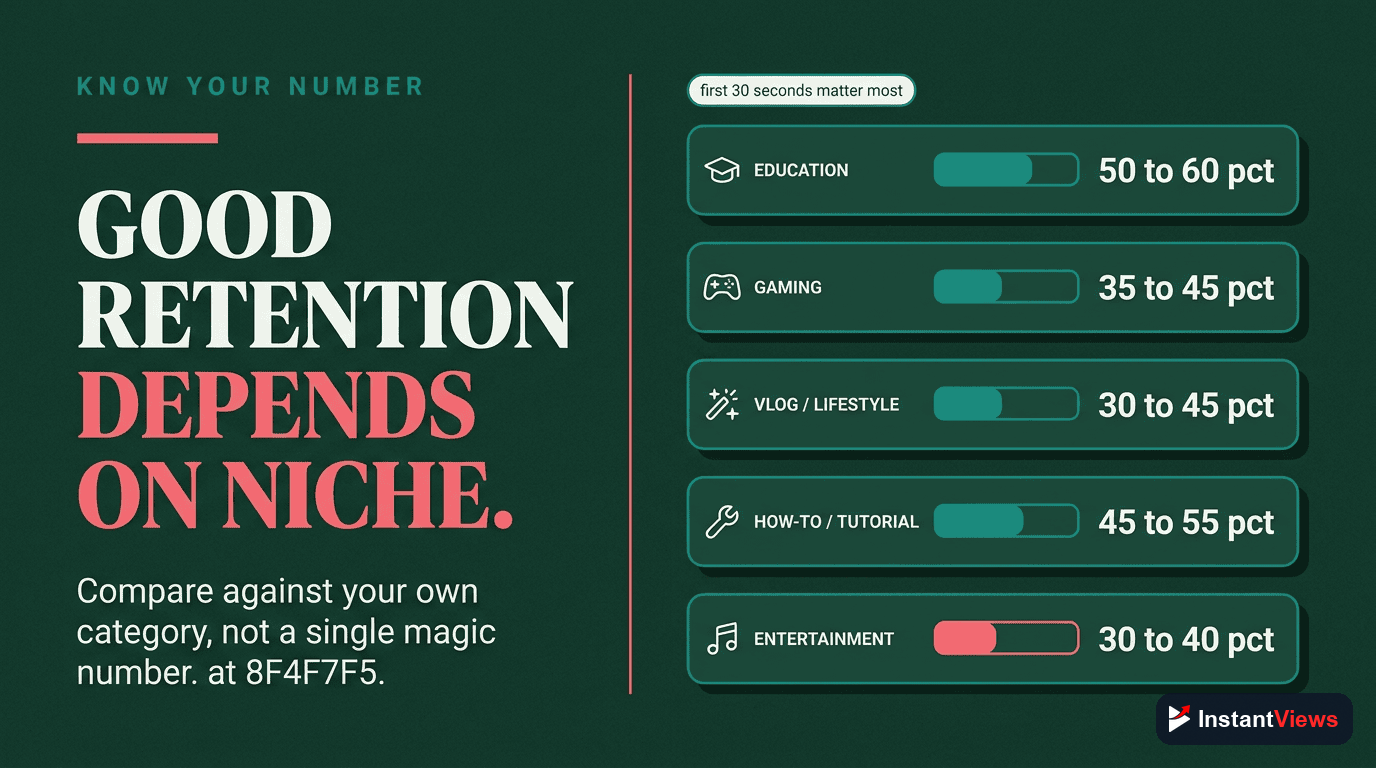
Improving Retention Rates
Now that you understand your retention data, here's how to systematically improve it:
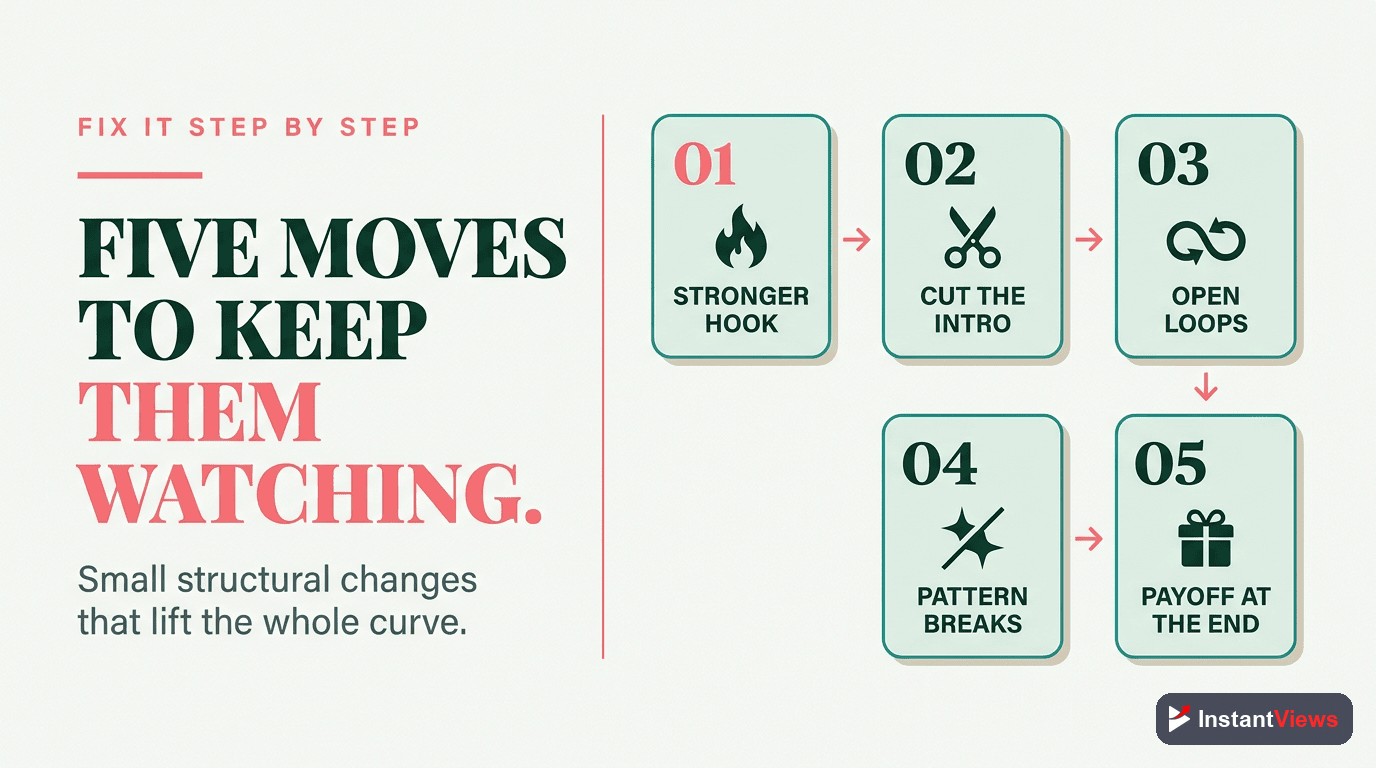
Strategy 1: Optimize Your Hook
The first 30 seconds determine whether you get 100 views or 100,000. Here's the formula for a high-retention hook:
Seconds 0-3: Visual/verbal confirmation of thumbnail promise
Seconds 3-8: Establish the problem or opportunity
Seconds 8-15: Tease the solution/outcome viewers will get
Seconds 15-30: Create a mini-loop to keep them watching
Example hook for "How to Edit Videos Faster":
[0-3s] "This one trick cut my editing time in half" [shows before/after comparison]
[3-8s] "Most editors waste 4 hours on tasks that should take 20 minutes"
[8-15s] "I'm about to show you the exact workflow that lets me edit a 10-minute video in under an hour"
[15-30s] "But first, here's the biggest editing mistake that's slowing you down..."
Read our complete guide on creating compelling YouTube video intros for more hook strategies.
Strategy 2: Master Video Pacing
Pacing is the rhythm of value delivery. Too slow and people leave; too fast and they feel overwhelmed. The secret is variation:
- Change visuals every 3-5 seconds - Cut to different angles, B-roll, graphics, or text overlays
- Vary your vocal pace - Speed up for excitement, slow down for emphasis
- Use pattern interrupts - Every 60-90 seconds, break the pattern with a question, graphic, or topic shift
- Cut ruthlessly - Remove every word that doesn't add value. Pauses, "ums," and repetition kill retention
Learn more about video pacing for maximum engagement.
Strategy 3: Structure for Retention
Your content structure should create natural "stay hooks" throughout the video:
The Chapter Preview Method
At the start, briefly preview all major points but don't give away the details. This creates multiple reasons to keep watching.
"Today I'm covering 5 retention strategies. Number 3 is controversial but it doubled my watch time. And number 5 is something YouTube doesn't want you to know." Now viewers stay to hear #3 and #5.
The Layered Value Approach
Give value early, but tease that deeper value comes later. This satisfies early viewers while giving reasons to stay.
For a video on "Instagram Growth," give one quick tip in the first minute, then say "That's just the surface level. The strategy that actually got me to 100k followers comes later in the video."
Strategic Chapter Placement
Use YouTube chapters to help viewers navigate, but structure them to encourage watching the full video.
Instead of "Introduction | Main Content | Conclusion," use specific value promises: "Common Mistake | The Fix | Advanced Strategy | Real Results." Each chapter title creates curiosity. See our guide on YouTube chapters SEO benefits.
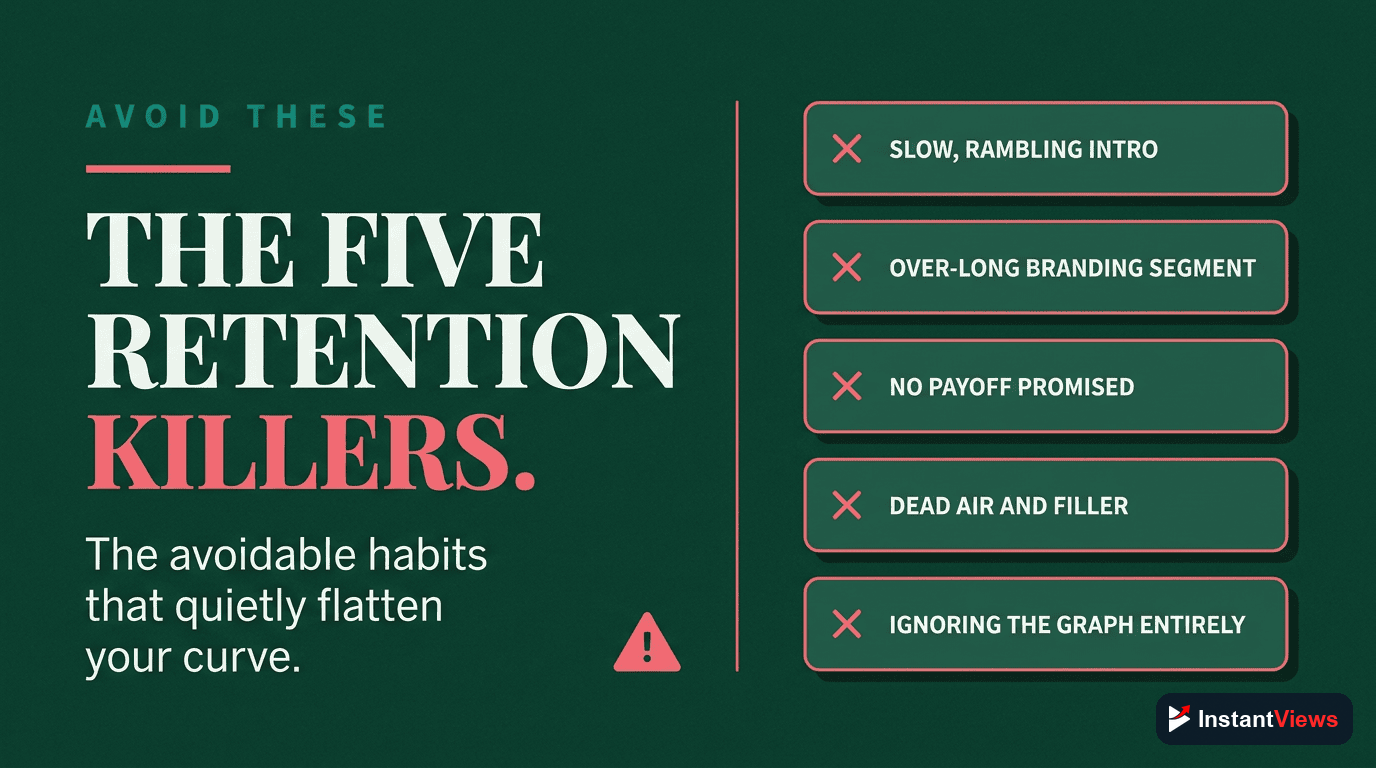
Strategy 4: Eliminate Retention Killers
Some elements consistently kill retention. Audit your videos for these problems:
| Retention Killer | Why It Fails | Quick Fix |
|---|---|---|
| Long Intros | Delays value delivery | Cut everything before the hook. Start with value. |
| Rambling/Tangents | Loses focus and momentum | Script key points. Cut any sentence that doesn't advance the topic. |
| Sudden Topic Shifts | Confuses viewers about what they're watching | Use transitions: "Now that you know X, let's cover Y..." |
| Dead Air/Long Pauses | Creates boredom and escape opportunities | Add B-roll, graphics, or music during pauses |
| Repetitive Content | Viewers already got the point | Say it once clearly, then move on |
| Answering Too Early | Viewers got what they came for | Partial answer early, full solution later |
Strategy 5: Use Emotional Peaks
Retention spikes when emotions spike. Build emotional moments throughout your video:
- Surprise: Reveal unexpected information or results
- Tension: Build to a moment of resolution
- Curiosity: Ask questions that get answered later
- Excitement: Show dramatic transformations or outcomes
Learn how to leverage emotional peaks in videos for better retention.
Using Retention for Content Strategy
Retention analytics shouldn't just improve individual videos - they should shape your entire content strategy.
Identifying Your Best-Performing Content
Go to YouTube Analytics and sort your videos by average view duration (not just views). Your highest-retention videos reveal:
- Topics your audience actually cares about (not just clicks)
- Formats that work (tutorial vs. vlog vs. list)
- Length sweet spots for your niche
- Presentation styles that resonate
Create more content in these high-retention categories. If your 8-minute tutorials get 55% retention while your 15-minute vlogs get 30%, the data is telling you something.
The Retention Snowball Effect
High-retention videos get promoted more by YouTube, which brings more viewers, which provides more data to improve future videos. Here's how to create this cycle:
Analyze Your Top 5 Retention Videos
Find commonalities in format, length, topic, and structure. Create a "success template" based on these patterns.
Create Content Series
High-retention topics should become series. If "Instagram Growth Tips" performed well, create "Instagram Growth Tips Part 2, 3, 4..." Each video recommends the next, compounding retention.
Use Retention to Plan Video Length
If your 10-minute videos average 45% retention (4.5 min watch time) and your 6-minute videos get 60% retention (3.6 min watch time), make 10-minute videos. Total watch time matters more than percentage.
Retention-Based Content Planning
Use this framework to plan your next videos:
- Identify retention patterns across your existing videos
- Create topic clusters around high-retention themes
- Plan video lengths based on what your audience actually watches
- Structure content using your proven retention techniques
- Cross-reference with CTR data to find the sweet spot
For more strategic planning, see our guide on creating content calendars that drive consistent views.

How Video Analyzer Predicts Retention
The InstantViews Video Analyzer uses advanced AI to predict retention issues before you publish. Here's what it analyzes:
1. Hook Strength Analysis
The analyzer examines your first 30 seconds for:
- Time to first value statement - How long before you deliver something meaningful
- Visual confirmation - Does the opening shot match your thumbnail promise
- Pacing metrics - Cuts per second, vocal speed, energy level
- Curiosity gaps - How many unanswered questions you create
It compares your hook against thousands of high-performing videos in your niche and predicts your 30-second retention rate.
2. Pacing Pattern Recognition
The AI tracks your video's rhythm by analyzing:
- Visual change frequency - How often scenes, angles, or graphics change
- Audio variance - Volume changes, music, sound effects
- Speech cadence - Speaking speed and pauses
- Energy decay - Whether enthusiasm drops over time
When pacing slows or becomes repetitive, the analyzer flags those timestamps as potential drop-off points.
3. Content Structure Scoring
The Video Analyzer evaluates your video's structure:
- Value distribution - Are key insights spread throughout or front-loaded?
- Chapter effectiveness - Do chapters create curiosity or just describe content?
- Callback presence - Do you reference earlier points to create cohesion?
- Payoff timing - When do you deliver on your title/thumbnail promise?
4. Comparative Analysis
Your video is compared against our database of successful videos in your category:
| Analysis Type | What It Measures | Prediction Output |
|---|---|---|
| Niche Benchmarking | Your metrics vs. similar successful videos | Expected retention curve with confidence range |
| Length Optimization | Ideal video length for your topic | Recommended cuts or expansions |
| Thumbnail-Content Match | Alignment between promise and delivery | Hook adjustment suggestions |
| Engagement Triggers | Presence of proven retention techniques | Where to add pattern interrupts |
Getting Your Retention Prediction
Using the Video Analyzer is simple:
- Upload your video or paste YouTube URL
- Get instant retention prediction with a projected retention graph
- Review flagged timestamps where drops are predicted
- Implement AI suggestions to improve retention before publishing
- Re-analyze after edits to confirm improvements
Get Your Retention Prediction
Upload your next video and get AI-powered retention predictions with specific timestamps to fix. Don't guess - know your retention before you publish.
Try Video Analyzer Free →
Common Retention Mistakes
Even experienced creators make these retention-killing mistakes:
Mistake 1: Optimizing for Average View Duration Instead of Retention Curve
Many creators focus on increasing total watch time without analyzing the curve shape. A 4-minute average could come from everyone watching 4 minutes then leaving, or from 50% watching the whole 8 minutes while 50% leave immediately.
The fix: Look at the curve shape. The second scenario (polarized retention) is better because you have an engaged core audience. YouTube's algorithm values strong retention among a subset more than mediocre retention from everyone.
Mistake 2: Ignoring Relative Retention
Absolute retention doesn't tell the full story. A 35% retention rate might be excellent for a 60-minute video but terrible for a 5-minute tutorial.
The fix: Always check relative retention. Being above the baseline is more important than hitting a specific percentage. Focus on beating YouTube's expectations for your video length and category.
Mistake 3: Making Videos Too Short to Avoid Drop-Offs
Some creators make 3-minute videos to maintain high percentage retention. But YouTube rewards total watch time, not percentages.
The fix: An 8-minute video with 40% retention (3.2 min watch time) beats a 3-minute video with 60% retention (1.8 min watch time). Make your videos as long as your content quality can support.
Mistake 4: Over-Optimizing the Hook at the Expense of the Middle
You nail the first 30 seconds but then the video falls apart. High initial retention followed by steep drops signals broken promises.
The fix: Your hook sets expectations - make sure your content delivers on them. If your hook promises "5 secrets," deliver all 5 with specific details. Don't bait and switch.
Mistake 5: Not Testing Different Formats
Sticking to one video format without testing alternatives limits your potential.
The fix: A/B test video structures. Try a talking-head video vs. a screen recording tutorial. Test listicle format vs. story format. Track retention differences and double down on what works.
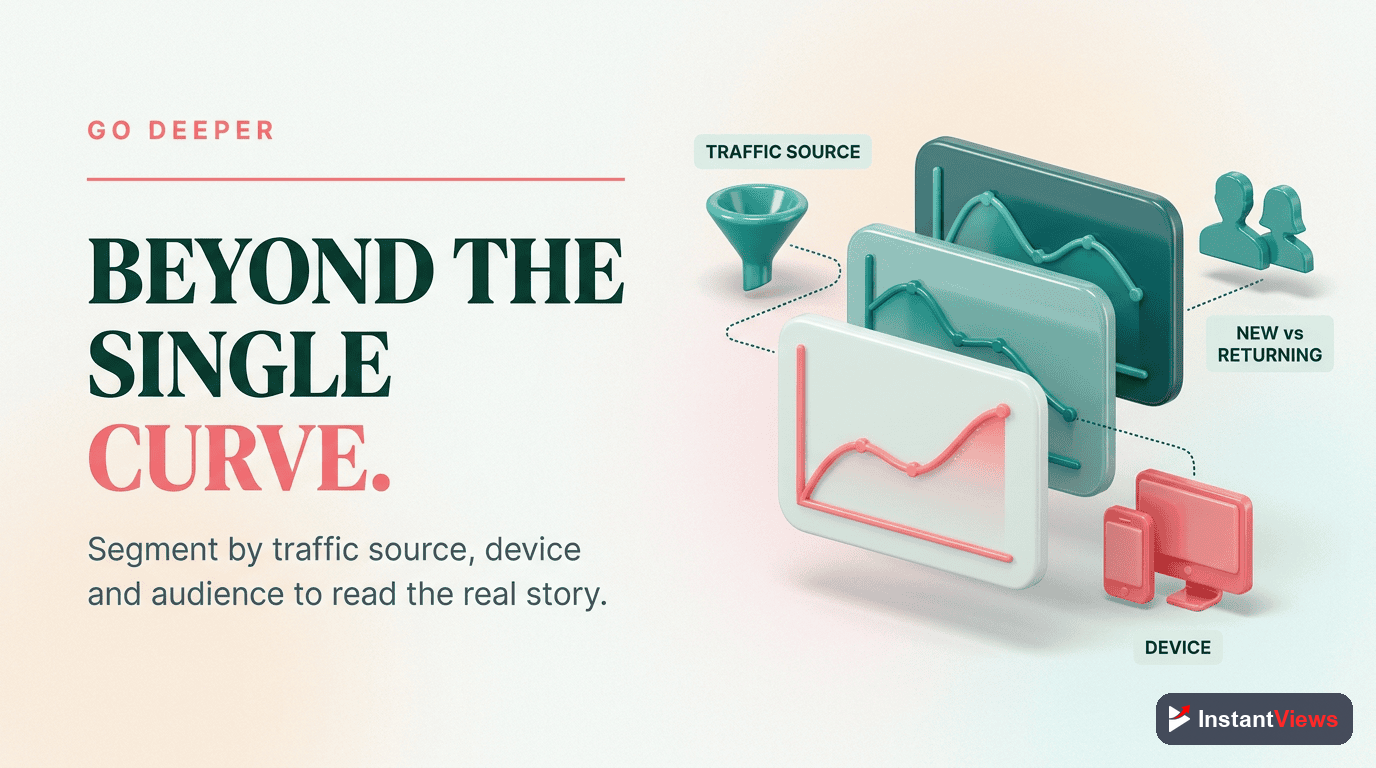
Advanced Retention Analysis
Once you've mastered the basics, these advanced techniques will give you an edge:
1. Traffic Source Retention Segmentation
Different traffic sources have different retention patterns:
- YouTube Search: Highest retention (intent-driven)
- Suggested Videos: Medium-high retention
- Browse Features: Medium retention (casual discovery)
- External Sources: Often lowest retention (context mismatch)
If your retention is low, check Analytics > Reach > Traffic Sources. If external sources dominate, your retention will naturally be lower. Optimize for converting more YouTube search and suggested video traffic.
2. New vs. Returning Viewer Retention
YouTube Analytics shows retention broken down by new vs. returning viewers. This reveals:
- If new viewers have lower retention: Your thumbnails/titles attract wrong audience
- If returning viewers have lower retention: You're not evolving or your core audience is getting fatigued
- If both are low: Fundamental content quality issues
3. Retention Velocity Analysis
Instead of just looking at total retention, analyze the rate of decline. A video that loses 2% retention per minute is healthier than one losing 5% per minute, even if they have the same average.
Calculate retention velocity: (Retention at 100% - Retention at 0%) / Video Length in Minutes
Lower is better. Track this across videos to identify which formats maintain engagement longest.
4. Predictive Retention Modeling
Use your historical data to predict future performance:
- Track retention for videos of similar topics/formats
- Calculate average retention curves for each category
- Before publishing, predict which category your new video fits
- Set realistic retention goals based on that category's average
- If the video underperforms, analyze why it deviated from the model
5. Retention Heat Mapping
Create a "retention heat map" by overlaying retention data onto your video script or timeline:
- Green zones: Retention spikes (rewatch points)
- Yellow zones: Normal gradual decline
- Red zones: Drop-off points
Analyze your green zones to understand what resonates. Analyze red zones to identify patterns you can avoid in future videos.
"The difference between a video with 100,000 views and one with 10,000 views is often just 5-10% better retention. Master retention analytics, and you master YouTube growth." - InstantViews Research Team
Frequently Asked Questions
A good retention rate varies by content type: Tutorial videos should aim for 50-60% average retention, Educational content 40-50%, Entertainment/Vlogs 30-40%, and Long-form content (30+ min) 25-35%. The first 30 seconds should maintain 80%+ retention regardless of niche. Focus on improving your retention relative to your previous videos rather than comparing to others.
Go to YouTube Studio > Analytics > Engagement tab > Scroll to "Audience retention". Here you'll see both absolute audience retention (exact viewer count at each moment) and relative audience retention (how your video compares to similar videos). Click any video to see its individual retention graph with detailed drop-off points.
Common retention drop-off causes include: slow intros (0-30 seconds), broken promises from thumbnail/title, long tangents or filler content, poor pacing or repetitive segments, technical issues like bad audio, and predictable endings where viewers leave early. Use the InstantViews Video Analyzer to identify exactly when and why viewers leave.
Absolute retention shows the actual percentage of viewers watching at each moment (e.g., "50% of viewers watched to 5:00"). Relative retention compares your video to similar YouTube content, showing whether your retention is above or below average for that video length and topic. High relative retention signals YouTube to promote your video more aggressively.
Yes, but with limitations. You can update titles, thumbnails, descriptions, and add chapters to help viewers navigate to interesting parts. However, you cannot edit the video content itself. For videos with poor retention, consider: creating an updated version, adding timestamps to help viewers skip to key moments, or using end screens to redirect to higher-performing content.
The InstantViews Video Analyzer uses AI to analyze your video pacing, hook strength, content structure, and engagement patterns. It compares your video against thousands of high-retention videos in your niche to predict potential drop-off points before you publish. You get specific timestamps where viewers might leave and actionable suggestions to improve retention.