- Watch time is the #1 metric that drives YouTube's algorithm - it matters more than views or subscribers
- Understanding traffic sources reveals where to focus optimization efforts for maximum growth
- Audience retention graphs show exactly when viewers drop off, enabling precise content improvements
- Revenue analytics help identify which content types generate the most income per view
- InstantViews Video Analyzer provides actionable insights to optimize your channel performance
YouTube Analytics is the most powerful tool in your creator arsenal - yet 95% of creators barely scratch the surface of what it can reveal about their channel performance.
The difference between creators who grow consistently and those who stagnate isn't talent or luck. It's their ability to read, understand, and act on the data YouTube provides.
This comprehensive guide will transform you from someone who occasionally checks view counts into a data-driven strategist who knows exactly what's working, what's not, and how to optimize every video for maximum impact.
Understanding YouTube Studio Analytics
YouTube Studio Analytics is divided into four main sections, each revealing different aspects of your channel performance:
Overview Tab
The Overview tab provides your channel's vital signs: views, watch time, subscribers, and estimated revenue (if monetized). This is your daily health check, showing performance over the last 28 days, 7 days, or custom ranges.
Real-time activity: See which videos are performing in the last 48 hours
Trend direction: Are you growing or declining compared to previous periods?
Top-performing content: Identify your best videos by views and watch time
Content Tab
The Content tab shows individual video performance metrics. This is where you analyze which specific videos succeed and why, comparing performance across your entire catalog.
Video-by-video comparison: Which titles/thumbnails drive the most clicks?
Retention patterns: What content keeps viewers engaged longest?
Traffic source breakdown: Where does each video get discovered?
Audience Tab
The Audience tab reveals who is watching: demographics, geography, when they're active, and what else they watch. This data is gold for content strategy and posting schedules.
Returning viewers: Measure audience loyalty and community strength
Subscription source: Which videos convert viewers to subscribers?
Watch patterns: Optimal upload times based on when your audience is online
Research Tab
The Research tab (formerly "Search") shows what your audience is searching for on YouTube. This helps you create content that meets existing demand rather than guessing what people want.

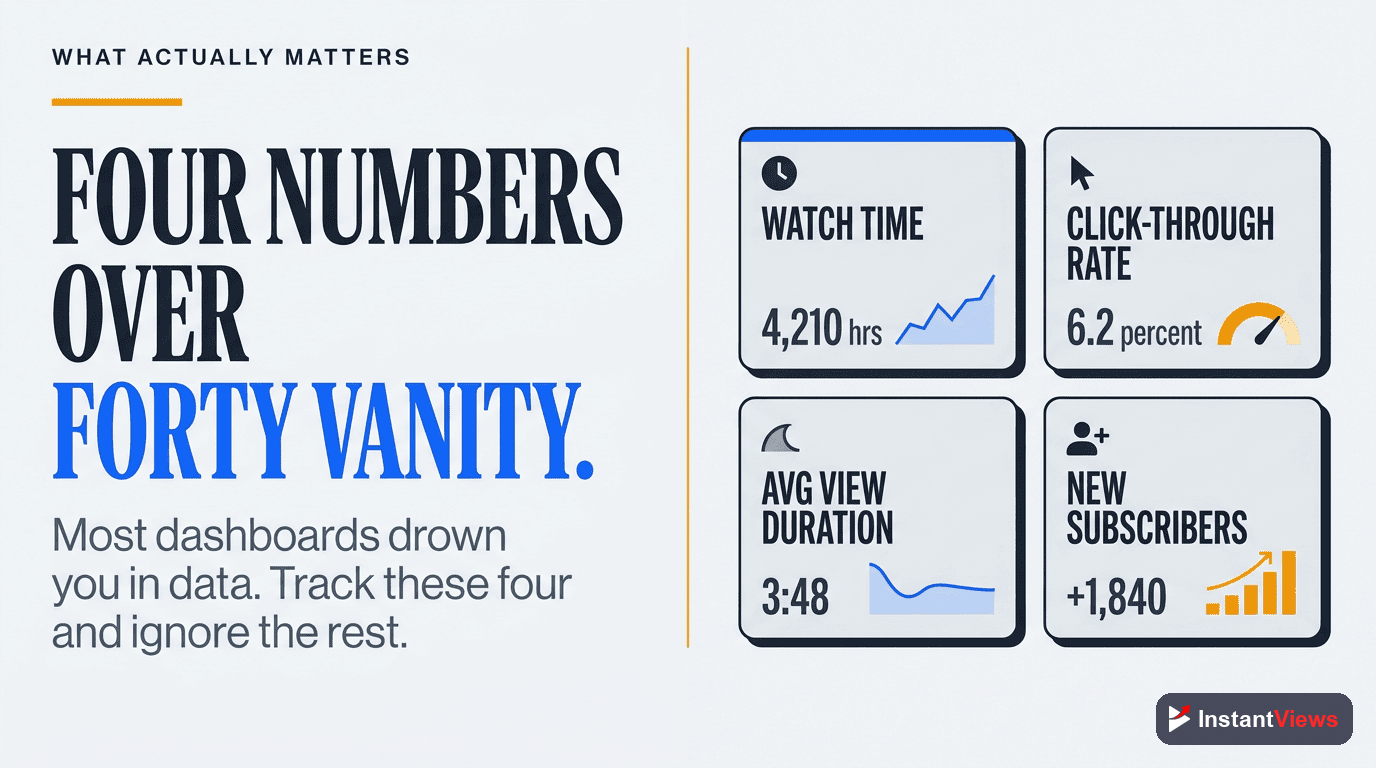
Key Metrics That Actually Matter
Not all metrics are created equal. Here are the metrics that actually drive growth, ranked by importance:
| Metric | Why It Matters | Good Benchmark | How to Improve |
|---|---|---|---|
| Watch Time | Primary algorithm ranking factor | 1,000+ hours/month for growth | Longer videos, better retention, consistent uploads |
| Average View Duration | Indicates content engagement quality | 50%+ of video length | Strong hooks, pacing, chapters for navigation |
| Click-Through Rate (CTR) | Measures thumbnail/title effectiveness | 4-10% (varies by niche) | A/B test thumbnails, optimize titles |
| Unique Viewers | Shows actual audience reach | Growing month-over-month | SEO optimization, external promotion |
| Subscriber Growth | Indicates audience loyalty | 2-5% conversion from views | CTAs, consistent value, community engagement |
| Impressions | How often YouTube promotes you | Increasing with channel growth | Publish consistently, improve CTR/retention |
These six metrics tell you everything you need to know about channel health. If all six are trending upward, you're growing. If any are declining, that's where you need to focus your optimization efforts.
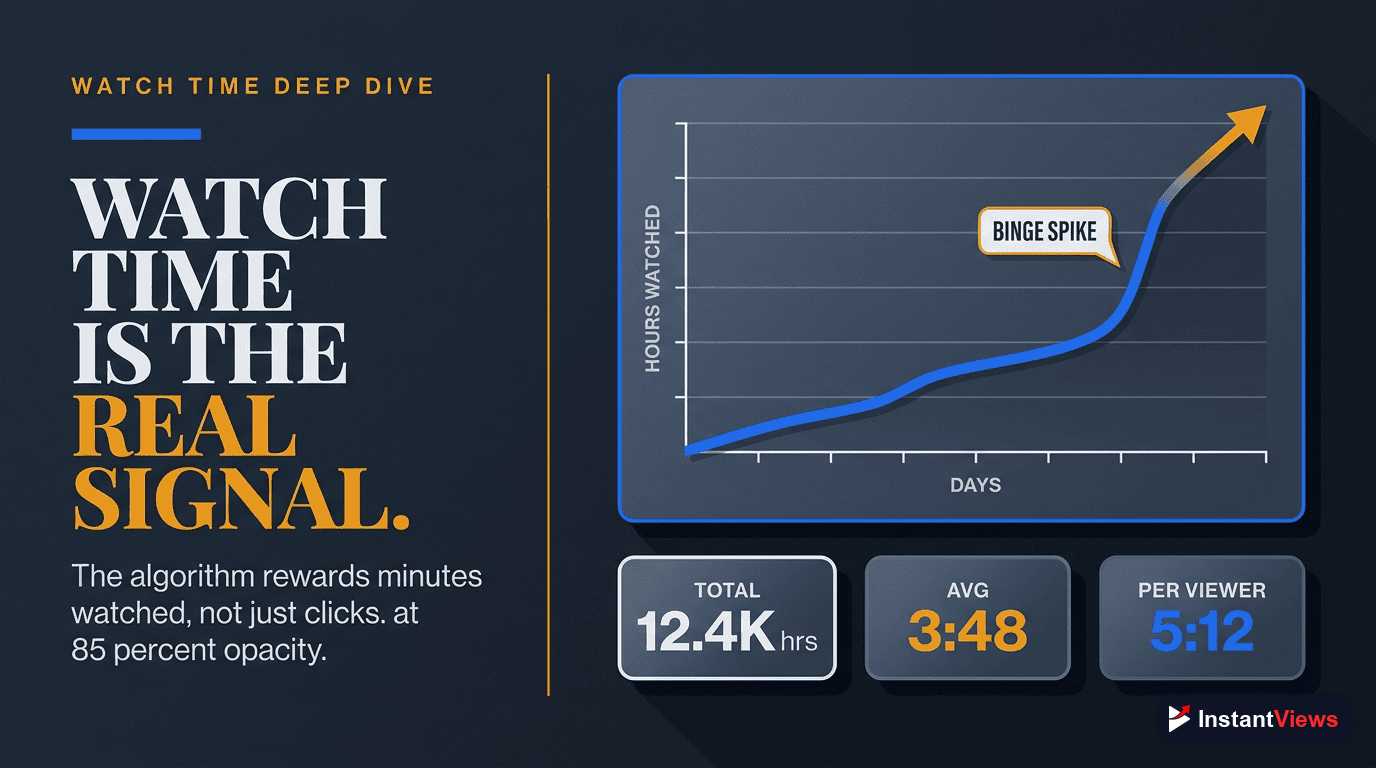
Watch Time Analysis Deep Dive
Watch time is YouTube's most important metric because it directly measures how much value you're providing to the platform. More watch time = more ad revenue for YouTube = more promotion for your content.
Understanding Watch Time vs. Views
Here's a critical distinction many creators miss:
- Views: How many times your video was clicked
- Watch Time: How many minutes people actually watched
YouTube cares far more about the second metric. A video with 1,000 views and 50% retention (5,000 total minutes watched) will outperform a video with 10,000 views and 10% retention (same 5,000 minutes).
Optimize for Minutes, Not Views
Create longer content that maintains engagement. A 15-minute video with 50% retention (7.5 minutes watched) generates more watch time than a 5-minute video with 80% retention (4 minutes watched).
Instead of making 5 separate 3-minute tutorials, create one comprehensive 15-minute guide with YouTube chapters for navigation. You'll generate 3x more watch time while providing better value.
Tracking Watch Time Trends
Monitor these watch time patterns in your analytics:
- Total watch time: Should grow consistently month-over-month
- Average view duration: Measures content quality - aim to improve this over time
- Watch time from subscribers vs. non-subscribers: Shows audience loyalty
- Watch time by traffic source: Reveals which discovery methods work best
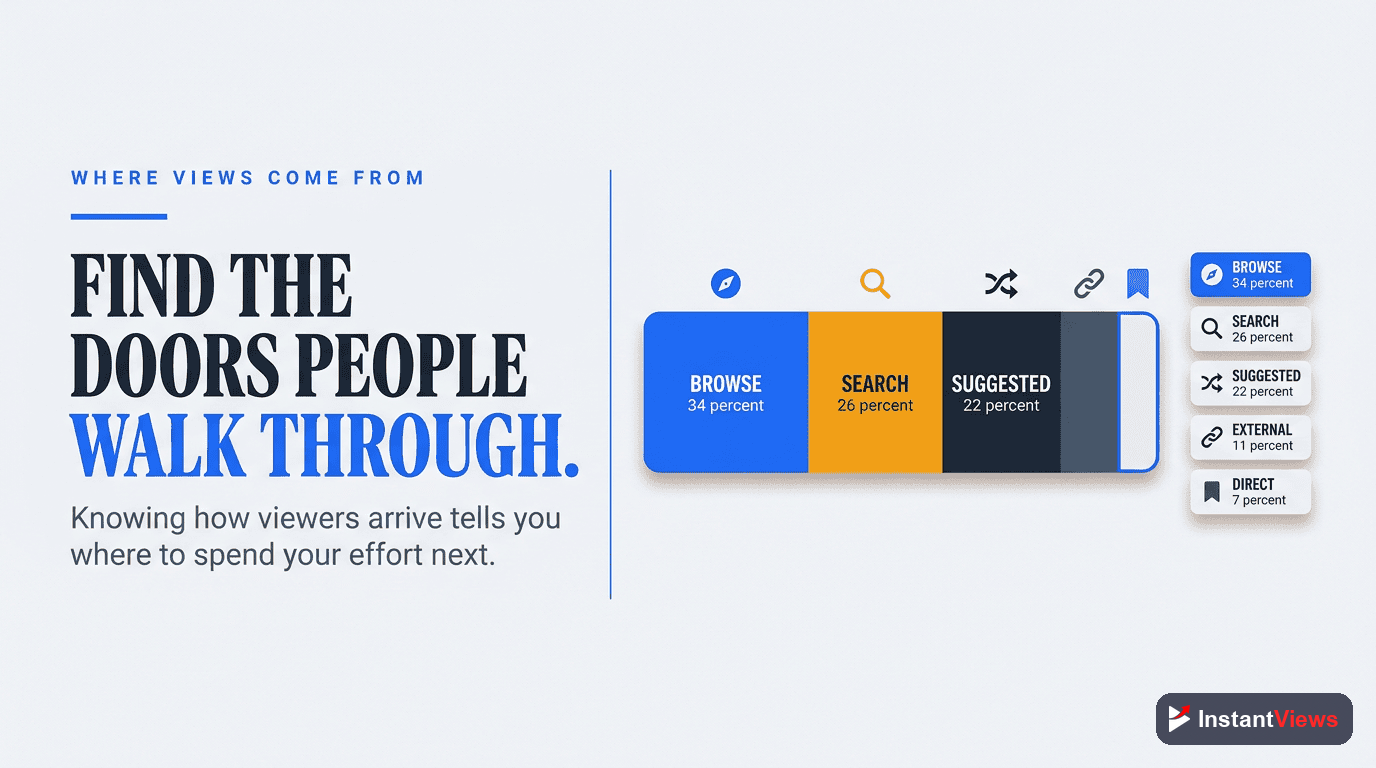
Traffic Source Analysis
Understanding where your views come from is crucial for knowing where to optimize your efforts. YouTube Analytics breaks traffic into several categories:
| Traffic Source | What It Means | How to Optimize |
|---|---|---|
| Browse Features | YouTube homepage, subscription feed | Upload consistently, improve CTR, engage subscribers |
| Suggested Videos | Recommended after/alongside other videos | Create series, use similar tags to successful videos |
| YouTube Search | Users searching keywords | Keyword research, SEO titles/descriptions, thumbnails |
| External | Google, social media, websites | Social promotion, Key Moments SEO, backlinks |
| Playlists | Your playlists or others' | Create strategic playlists, optimize playlist titles |
| Channel Pages | Direct visits to your channel | Organize channel layout, featured content |
Traffic Source Growth Strategy
Healthy channels have diversified traffic sources. Here's the ideal distribution:
- Browse Features: 25-35% - Shows YouTube trusts your content
- Suggested Videos: 30-45% - Algorithm actively promoting you
- YouTube Search: 15-25% - Evergreen content with SEO value
- External: 5-15% - Audience bringing new viewers
- Other: 5-10% - Playlists, channel pages, notifications
If more than 60% of your traffic comes from a single source, you're vulnerable. Diversify by optimizing for other discovery methods to build a more resilient channel.
Audience Retention Insights
The audience retention graph is the most actionable data in YouTube Analytics. It shows you exactly when viewers click away, revealing:
- Whether your intro hooks viewers or loses them immediately
- Which sections are engaging vs. boring
- Where to trim content or add more value
- If your video delivers on the thumbnail/title promise
Reading Retention Graphs
YouTube provides two retention views:
Absolute Retention
Shows the percentage of your video that viewers watched at each moment. This reveals exactly where people drop off and which parts they rewatch or skip.
Look for sharp drops - these indicate boring sections, misleading expectations, or technical issues. Peaks show valuable content that viewers replay or don't skip.
Relative Retention
Compares your retention to other YouTube videos of similar length. This shows whether you're above or below average, helping you understand if your content is competitive.
Videos significantly above the average line are exceptional. Videos below average need improvement in pacing, hooks, or value delivery. Use this to prioritize which videos to study and replicate.
Improving Retention Based on Data
Here's how to act on retention insights:
- First 30 seconds drop: Your hook isn't strong enough - see our guide on YouTube hooks that keep viewers watching
- Mid-video drops: Content drags or doesn't deliver value - improve video pacing
- Gradual decline: Natural for longer videos, but can improve with chapters and better content structure
- End screen drops: Outros are too long or repetitive - keep them under 10 seconds

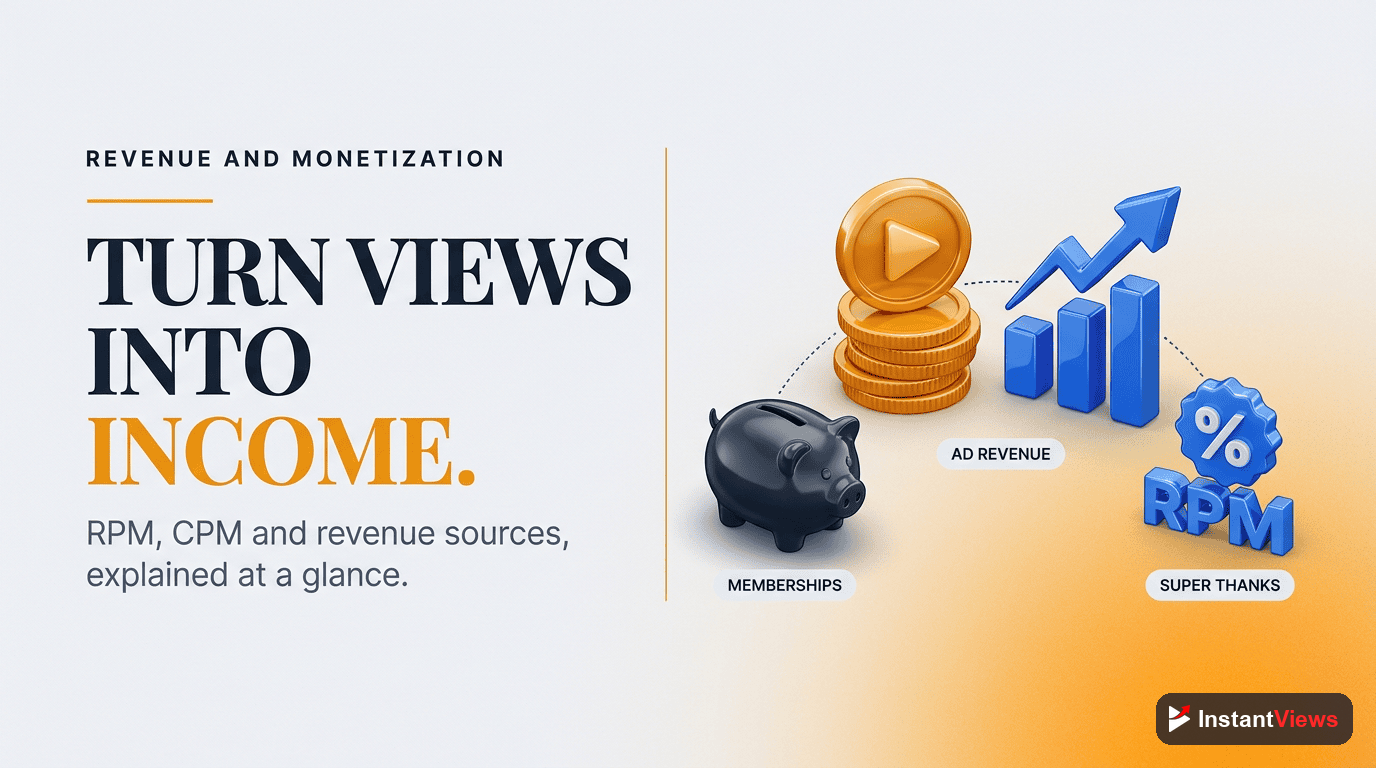
Revenue Analytics & Monetization
If you're monetized, revenue analytics reveal which content types generate the most income, helping you maximize earnings while creating content you enjoy.
Understanding RPM and CPM
Two critical monetization metrics:
- CPM (Cost Per Mille): How much advertisers pay per 1,000 ad impressions. This varies by niche, season, and viewer demographics.
- RPM (Revenue Per Mille): How much YOU earn per 1,000 views after YouTube's cut. This is your actual earning metric.
| Content Type | Typical CPM Range | Why It Varies |
|---|---|---|
| Finance/Investing | $20-$50+ | High-value audience, premium advertisers |
| Tech Reviews | $8-$20 | Engaged audience with buying intent |
| Gaming | $2-$8 | Younger audience, lower advertiser demand |
| Entertainment/Vlogs | $3-$10 | Broad audience, moderate advertiser interest |
| Education | $6-$15 | Engaged viewers, mid-range advertiser demand |
Maximizing Revenue with Analytics
Use revenue analytics to identify:
- High-RPM topics: Create more content in these profitable niches
- Seasonal patterns: CPMs spike in Q4 (October-December) - plan major content pushes then
- Audience geography: US, UK, Canada viewers typically generate higher CPMs
- Video length sweet spot: Longer videos allow more ad placements, but must maintain retention
Never sacrifice content quality for ad revenue. Viewers will notice excessive mid-roll ads and abandon your content. The best strategy is creating longer, high-retention videos that naturally support multiple ad placements without disrupting the viewing experience.
How InstantViews Video Analyzer Provides Channel Insights
While YouTube Analytics shows you WHAT is happening with your channel, the InstantViews Video Analyzer reveals WHY it's happening and HOW to fix it.
Here's how our Video Analyzer enhances your analytics strategy:
Retention Drop-Off Analysis
Upload any video and get frame-by-frame analysis of exactly where viewers lose interest. Unlike YouTube's basic retention graph, we show you the specific content causing drop-offs with visual markers and actionable recommendations.
Metadata Optimization Scoring
Analyze your titles, descriptions, and tags against thousands of high-performing videos in your niche. Get specific suggestions to improve discoverability across all traffic sources.
Competitor Benchmarking
Compare your videos against top performers in your niche. See exactly what successful creators are doing differently in terms of structure, pacing, hooks, and content strategy.
Chapter & Timestamp Recommendations
Automatically generate optimized chapter titles and timestamps that improve both user experience and SEO. Our AI analyzes your content and suggests chapters that match search intent for maximum discoverability.
Optimize Your Channel Performance
Get instant insights into retention, pacing, SEO, and engagement with our AI-powered Video Analyzer. Turn analytics into actionable growth strategies.
Analyze Your Videos →
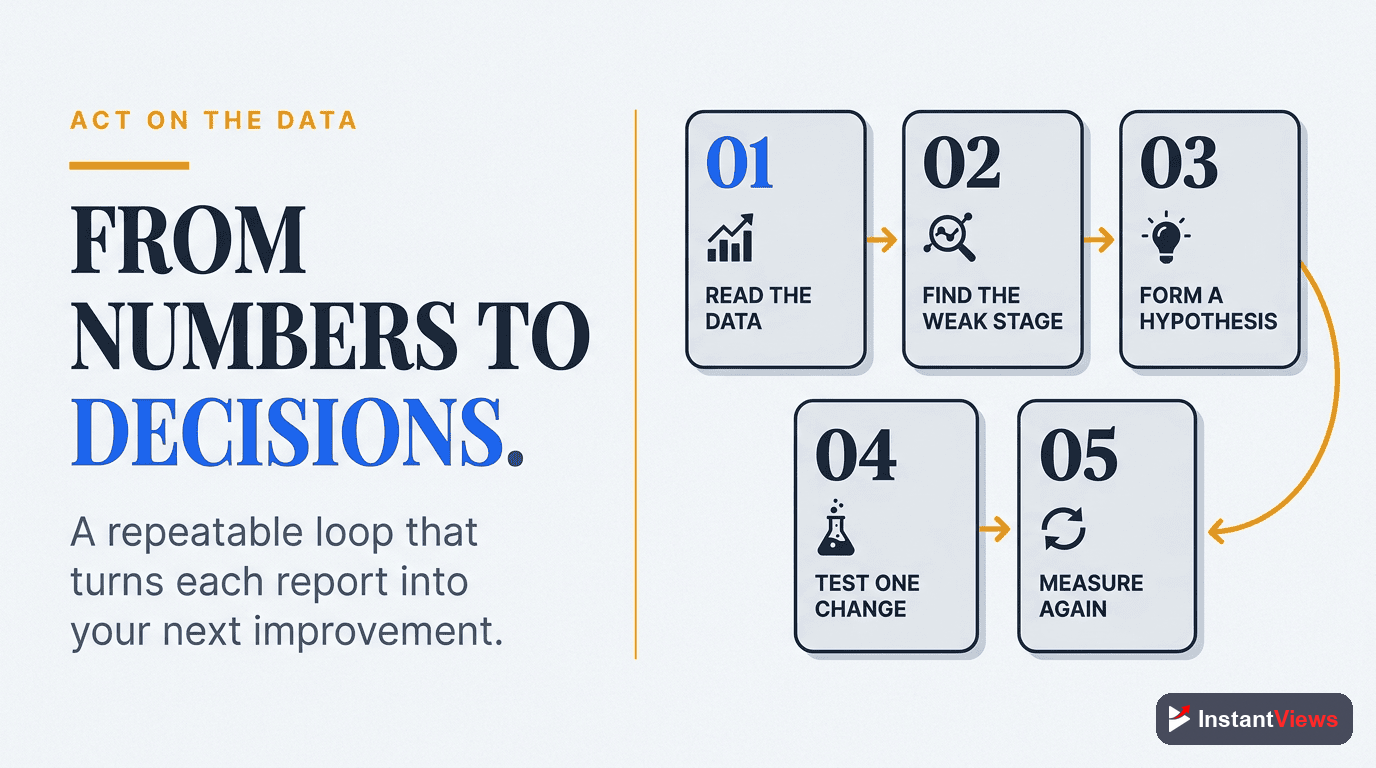
Data-Driven Optimization Strategies
Here's how to turn analytics insights into concrete actions that grow your channel:
Strategy 1: The Content Audit
Quarterly, analyze your top 20 videos by watch time and identify patterns:
- What topics consistently perform well?
- What video length gets the best retention?
- Which thumbnail styles generate the highest CTR?
- What traffic sources drive the most engaged viewers?
Create more content that matches these winning patterns while experimenting with 20% of your uploads to discover new opportunities.
Strategy 2: The A/B Testing Framework
Test one variable at a time to isolate what works:
- Weeks 1-2: Test two thumbnail styles on similar videos
- Weeks 3-4: Test different title formats (question vs. statement vs. list)
- Weeks 5-6: Test video length (short vs. long-form)
- Weeks 7-8: Test different content structures or hooks
Track CTR and retention for each test, then implement winners across all future content.
Strategy 3: The Traffic Source Expansion
If you're over-reliant on one traffic source, deliberately optimize for others:
| To Increase | Action Steps |
|---|---|
| Browse Features | Upload more frequently (2-3x/week), improve thumbnails, engage subscribers |
| Suggested Videos | Create series with consistent topics, study competitors' tags, optimize end screens |
| YouTube Search | Keyword research, SEO-optimized titles/descriptions, long-tail keyword targeting |
| External Traffic | Promote on social media, optimize for Google Key Moments, guest posts |
Strategy 4: The Retention Recovery Plan
If average view duration is declining:
- Analyze your last 10 videos' retention graphs
- Identify the average drop-off point (e.g., 3 minutes into 10-minute videos)
- Restructure future videos to deliver maximum value BEFORE that point
- Use the audience retention improvement guide for specific tactics
- Add chapters to help viewers navigate to their desired content
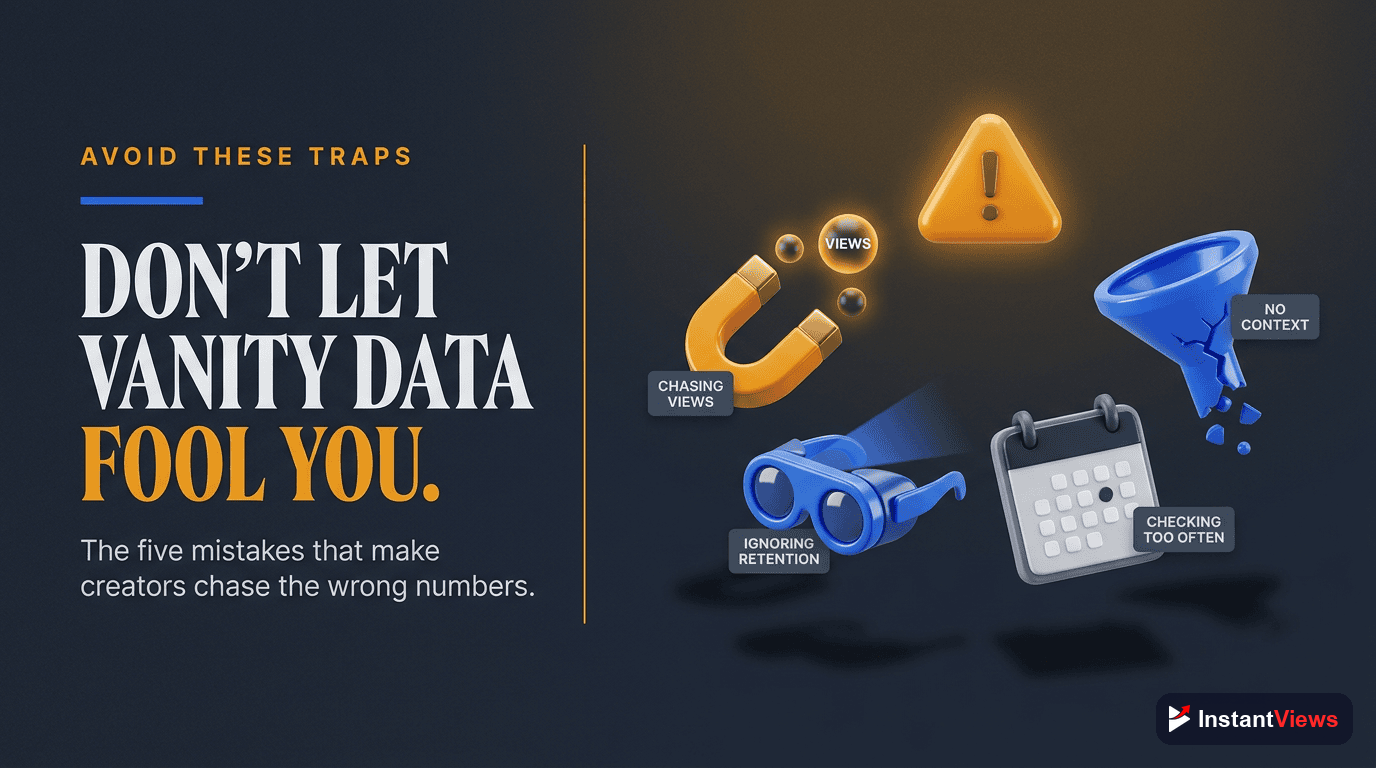
Common Analytics Mistakes
Avoid these critical errors that lead creators astray:
Mistake 1: Obsessing Over Vanity Metrics
Views and subscribers are ego metrics. They feel good but don't directly drive growth. Focus instead on:
- Watch time (algorithm ranking)
- Average view duration (content quality)
- CTR (discoverability effectiveness)
Mistake 2: Making Decisions on Small Sample Sizes
Don't radically change your strategy based on one video's performance. Wait until you have at least 5-10 videos following a similar strategy before evaluating results.
Mistake 3: Ignoring Seasonal Patterns
Views naturally fluctuate based on seasons, holidays, and trends. Always compare performance to the same period last year, not just last month.
Mistake 4: Not Segmenting Your Data
Analyze subscribers vs. non-subscribers separately. They behave differently, and treating them as one audience masks important insights about loyalty vs. discovery.
Mistake 5: Paralysis by Analysis
Don't spend more time analyzing than creating. Set specific times for analytics review (weekly 30-minute sessions), then focus the rest of your time on content production.
Conclusion: From Data to Growth
YouTube Analytics isn't just about numbers - it's about understanding your audience, optimizing your content, and making strategic decisions that compound into massive growth.
The creators who succeed are those who:
- Check analytics regularly but don't obsess over daily fluctuations
- Focus on actionable metrics (watch time, retention, CTR) over vanity metrics
- Test systematically and implement what works
- Diversify traffic sources for sustainable growth
- Use tools like InstantViews Video Analyzer to turn insights into action
Master your analytics, and you'll master your channel's growth. Start by picking one insight from this guide and implementing it in your next video. Track the results, refine your approach, and keep optimizing.
"The data is there. The insights are waiting. The only question is whether you'll act on them." - YouTube Creator Playbook
Frequently Asked Questions
Access YouTube Analytics through YouTube Studio. Click your profile icon, select "YouTube Studio," then click "Analytics" in the left sidebar. You can view channel-level analytics or individual video performance. The dashboard shows Overview, Content, Audience, and Research tabs with comprehensive metrics about your channel performance.
Watch time (total minutes watched) is the most important metric because it directly influences YouTube's algorithm. High watch time signals engaging content that keeps viewers on the platform. While views, CTR, and audience retention are important, watch time is the primary ranking factor YouTube uses to recommend videos.
Check your analytics at least weekly for active channels. Review overall trends weekly, dive deep into specific metrics monthly, and analyze individual video performance 48 hours after publishing. For new channels, daily checks help understand patterns, but avoid obsessing over small fluctuations that are normal in the first few months.
A good average view duration is 50% or higher of your total video length. For 10-minute videos, aim for 5+ minutes watched. However, this varies by content type: tutorials often see 60-70% retention, vlogs 40-50%, and longer documentaries 30-40%. Focus on improving your own baseline rather than comparing to others.
Diversify traffic by optimizing for YouTube search (SEO), creating shareable content for external sources, improving thumbnails/titles for Browse Features, and encouraging viewers to subscribe for their home feed. Use the InstantViews Video Analyzer to optimize your content for discoverability across all traffic sources.
YouTube Analytics typically updates every 24-48 hours, with some metrics showing near real-time data and others taking longer to process. Revenue analytics can take 2-3 days. During high traffic periods, delays may extend to 72 hours. If data hasn't updated in over a week, check YouTube's status page or contact support.