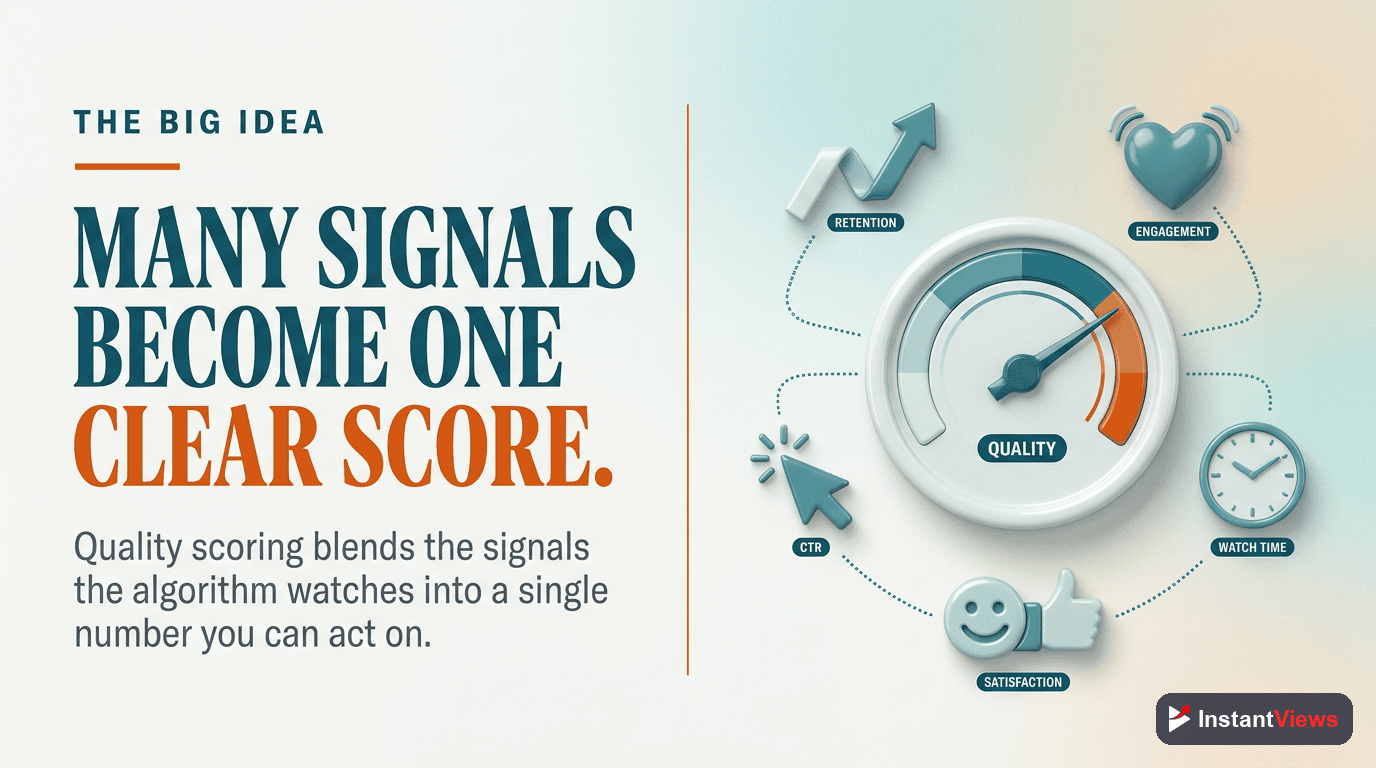
- Content quality scores measure multiple performance factors weighted by their impact on success
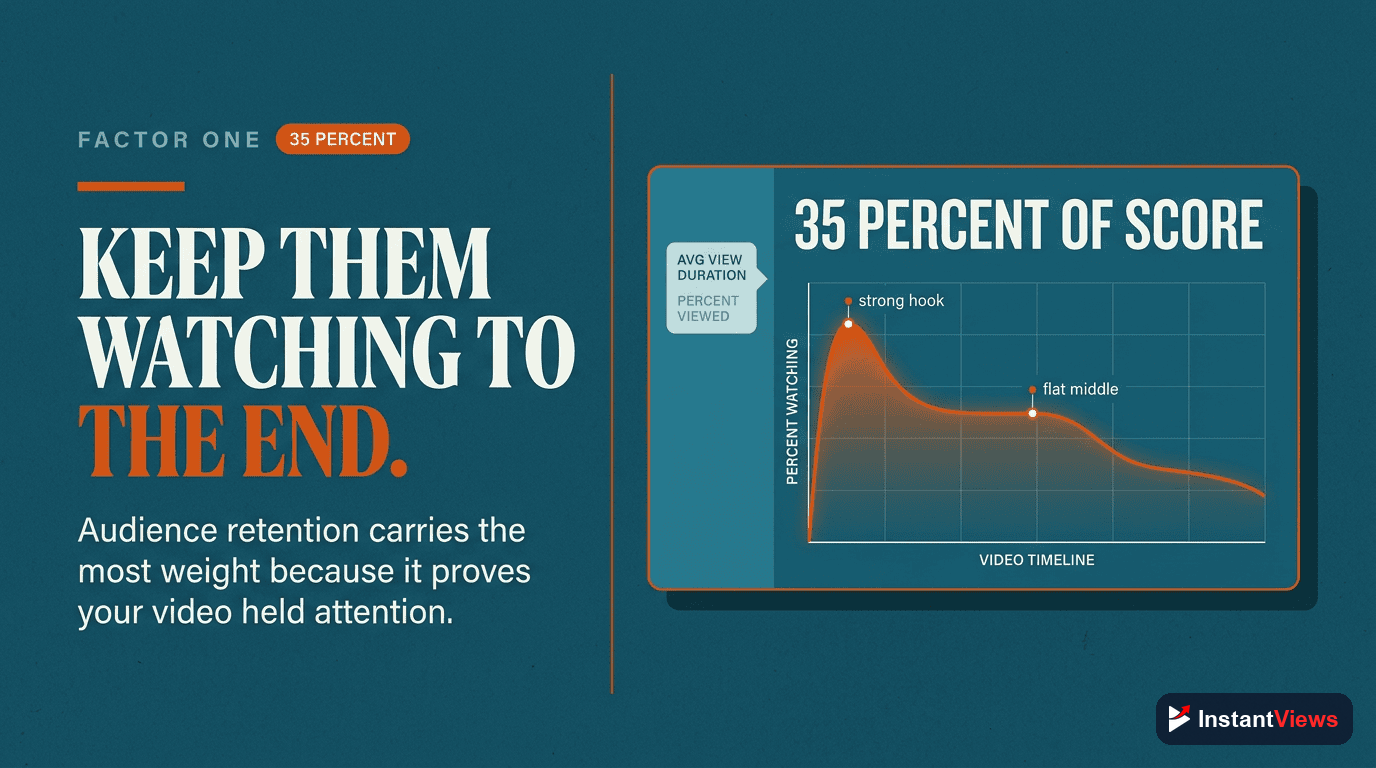
- Audience retention (35% weight) is the single most important quality factor for YouTube
- Engagement rate, CTR, watch time, and viewer satisfaction all contribute to overall quality
- Scores above 70 indicate good content; above 80 indicates excellent content
- Use the InstantViews Video Analyzer to get detailed quality scores before publishing
Every successful YouTube video shares something in common: high content quality. But quality is not subjective - it is measurable through specific metrics that YouTube's algorithm tracks and weights.
Understanding how content quality is scored gives you a massive advantage. You can identify exactly which aspects of your videos need improvement and optimize them systematically.
This comprehensive guide breaks down the complete content quality scoring system, explaining each factor, its weight, and how to improve your scores.
What Is Content Quality Scoring?
Content quality scoring is a composite metric that evaluates your video's performance across multiple dimensions. Unlike single metrics (views, likes, comments), quality scores combine several factors to give you a holistic measure of how well your content performs.
A quality score typically ranges from 0 to 100, with higher scores indicating better overall performance. The score is calculated by:
- Measuring specific performance metrics
- Normalizing each metric to a 0-100 scale
- Applying weighted importance to each factor
- Combining them into a final score
Why Quality Scores Matter
YouTube's algorithm is fundamentally designed to promote quality content. When your quality score improves, several things happen:
- More impressions: YouTube shows your videos to more people
- Better placement: Your content appears in search results and recommendations
- Higher CTR: Better positioning leads to more clicks
- Increased watch time: More views generate more total watch hours
- Channel growth: The algorithm favors channels with consistently high-quality content
Data shows that videos with quality scores above 80 receive 3-5x more impressions than videos scoring below 60, even from the same channel.
Quality scores are relative to your niche and audience size. Do not compare your scores to channels in completely different niches or with vastly different subscriber counts.

Factor #1: Audience Retention (35%)
Audience Retention
The percentage of your video that viewers watch on average. This is the single most important quality factor because it directly measures how engaging and valuable your content is.
Average view duration, retention curve shape, first 30-second retention, and drop-off points throughout the video.
Benchmarks:
- 40-50% average retention: Below average
- 50-60% average retention: Average
- 60-70% average retention: Good
- 70%+ average retention: Excellent
The shape of your retention curve matters too. A smooth decline is better than sharp drop-offs. Ideally, you want a curve that stays above 70% for the first third, above 50% for the middle third, and finishes above 40%.
Factor #2: Engagement Rate (25%)
Engagement Rate
The combined rate of likes, comments, shares, and saves relative to total views. High engagement signals that viewers found your content valuable enough to interact with it.
Likes per view, comments per view, shares per view, saves to playlists, and like-to-dislike ratio.
Benchmarks:
- 2-4% engagement rate: Below average
- 4-6% engagement rate: Average
- 6-8% engagement rate: Good
- 8%+ engagement rate: Excellent
Engagement rate is calculated as: (Likes + Comments + Shares) / Views × 100

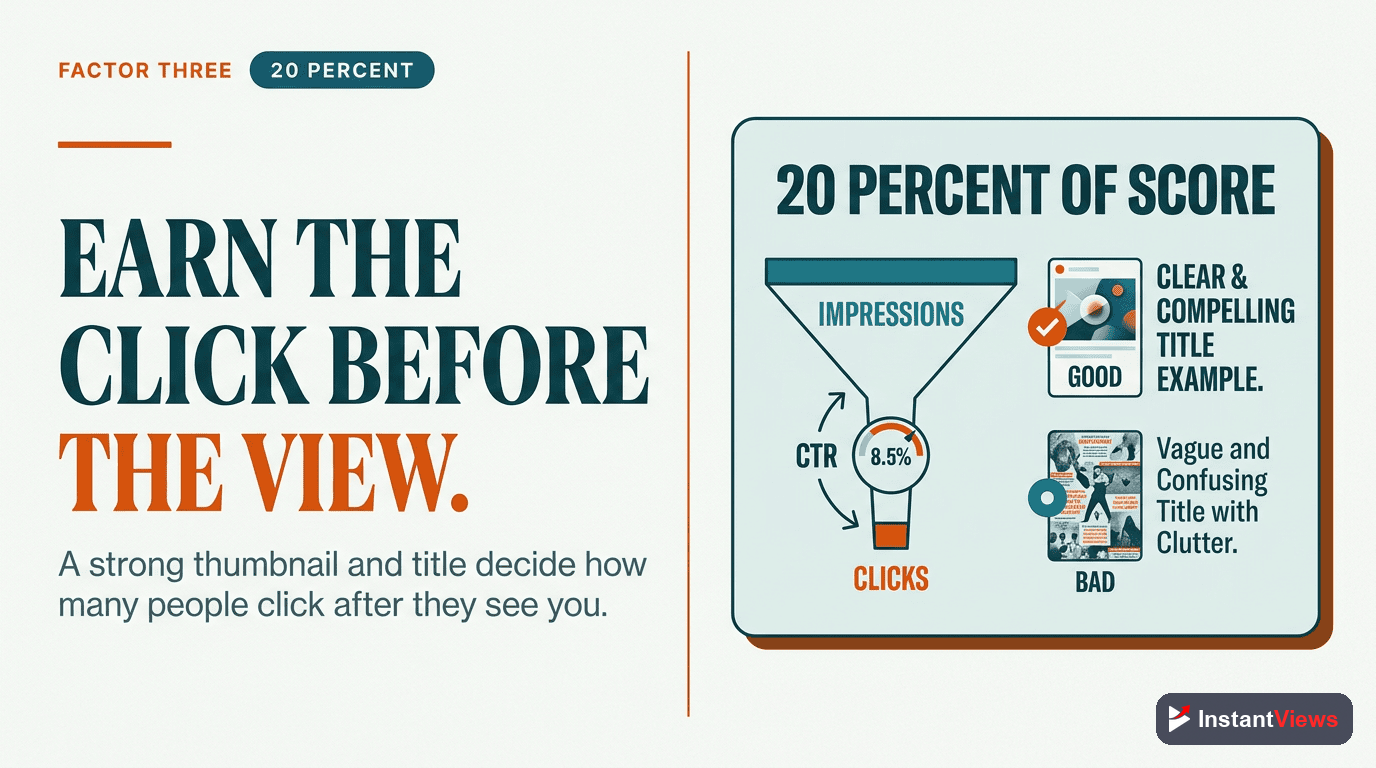
Factor #3: Click-Through Rate (20%)
Click-Through Rate (CTR)
The percentage of people who click on your video after seeing it in their feed, search results, or recommendations. High CTR means your title and thumbnail effectively communicate value.
Impressions vs. clicks, CTR trends over time, CTR by traffic source, and thumbnail performance.
Benchmarks:
- 2-4% CTR: Below average
- 4-6% CTR: Average
- 6-10% CTR: Good
- 10%+ CTR: Excellent
Note that CTR varies significantly by traffic source. Homepage CTR is typically lower (2-4%) while search CTR is higher (8-15%). Focus on improving CTR for your dominant traffic sources.
Factor #4: Session Watch Time (15%)
Session Watch Time
The total time viewers spend on YouTube after watching your video. If viewers watch more of your content or other content on the platform, it signals high quality.
Total session duration, videos watched per session, next-video retention, and end screen effectiveness.
Why it matters: YouTube wants to keep viewers on the platform. Videos that increase overall session time get prioritized in recommendations because they help YouTube achieve this goal.
The best creators think about their channel as a content ecosystem where each video leads naturally to others, maximizing total session watch time.

Factor #5: Viewer Satisfaction (5%)
Viewer Satisfaction
Implicit signals that indicate whether viewers got what they expected from your video. This includes survey responses and behavior patterns that signal satisfaction or dissatisfaction.
Survey responses, rapid bounces, "not interested" clicks, and whether viewers return to your channel.
While viewer satisfaction has the smallest direct weight, it indirectly impacts other factors. Dissatisfied viewers leave early (hurting retention), do not engage (hurting engagement rate), and click "not interested" (reducing future impressions).

How Scores Are Calculated
Content quality scores use a weighted average formula. Here's a simplified example:
| Factor | Your Score | Weight | Contribution |
|---|---|---|---|
| Audience Retention | 75/100 | 35% | 26.25 |
| Engagement Rate | 68/100 | 25% | 17.00 |
| Click-Through Rate | 82/100 | 20% | 16.40 |
| Session Watch Time | 71/100 | 15% | 10.65 |
| Viewer Satisfaction | 88/100 | 5% | 4.40 |
| Total Quality Score | 74.70 | ||
This example video would receive a quality score of 75/100 (rounded), which falls into the "good" category.
Analyze Your Video Quality
Get instant quality scores across all factors with detailed improvement suggestions using our Video Analyzer.
Analyze Your Video →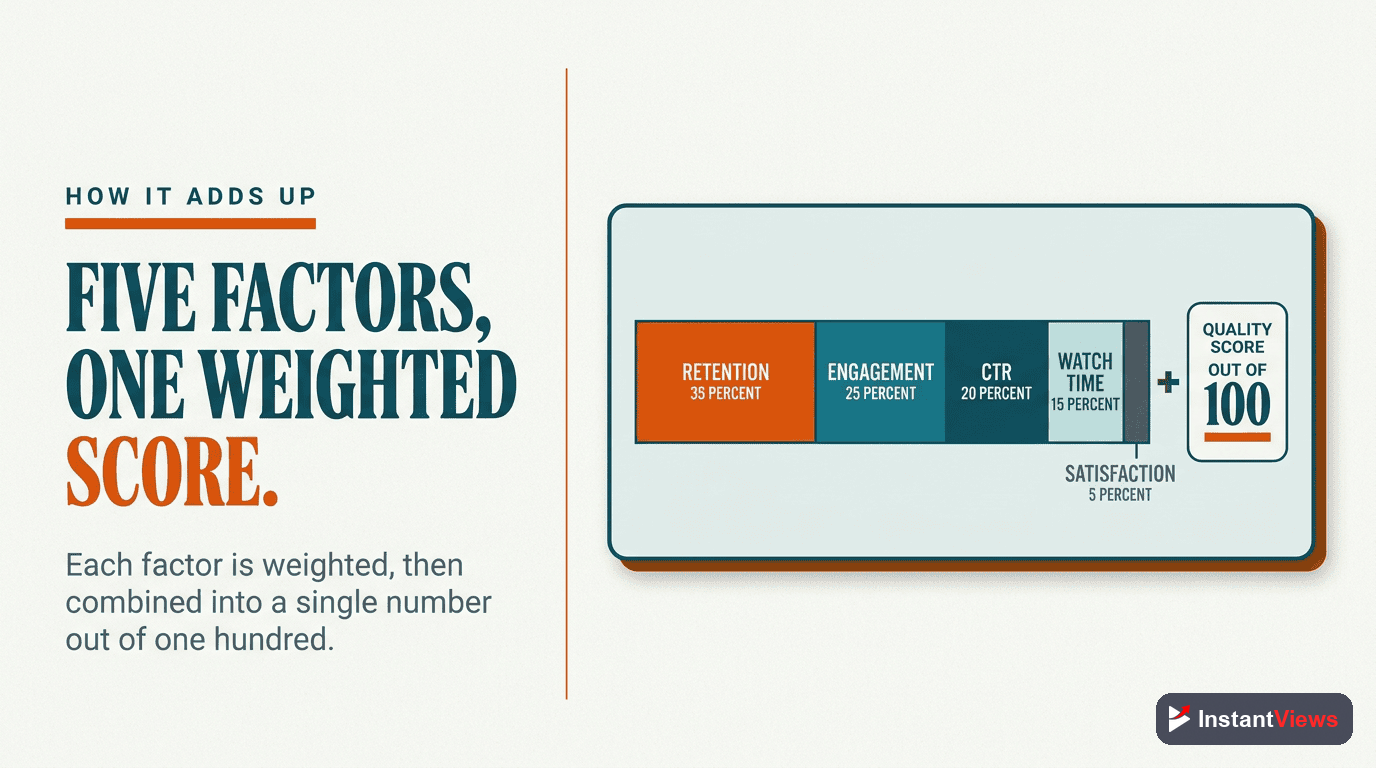
How to Improve Your Quality Score
Improving your quality score requires a strategic approach. Here's the priority order for maximum impact:
1. Focus on Retention First (Biggest Impact)
Since retention carries 35% weight, improving it has the largest effect on your overall score. Even a 5-point improvement in retention can increase your total score by 1.75 points.
Quick wins:
- Cut the first 30 seconds of your next video and start with the hook
- Remove all filler words and pauses in editing
- Add pattern interrupts (visual changes, topic shifts) every 60 seconds
- Create chapter markers to help viewers navigate
2. Optimize CTR (High ROI)
Improving CTR is relatively easy compared to other factors and carries 20% weight. Better CTR means more views, which improves all other metrics.
Quick wins:
- A/B test your thumbnails using YouTube's test feature
- Rewrite titles to include numbers and specific outcomes
- Use high-contrast colors in thumbnails (avoid muted tones)
- Add emotion to faces in thumbnails (surprise, excitement, curiosity)
3. Boost Engagement Rate
Engagement is highly controllable through content strategy and CTAs. It carries 25% weight, making it critical to overall scores.
Quick wins:
- Ask a specific question in the first 2 minutes and request comments
- Create content that naturally sparks debate or discussion
- Pin an engaging question as the first comment
- Include a mid-video CTA asking for likes if viewers find value
4. Extend Session Watch Time
Session watch time is about creating a content ecosystem where each video leads to another. At 15% weight, it is significant for growth.
Quick wins:
- Create a series of related videos and link them
- Use end screens to suggest the most relevant next video
- Reference other videos during content to drive internal clicks
- Organize content into playlists for binge-watching
5. Maintain Viewer Satisfaction
Viewer satisfaction is about trust and delivering on promises. Though it is only 5% directly, it prevents negative signals that hurt other factors.
Quick wins:
- Deliver on thumbnail and title promises within the first minute
- Avoid clickbait that creates misleading expectations
- Match your video's pacing and tone to audience preferences
- End with clear next steps or actionable takeaways
"Quality is not an accident. It is the result of intentional design, careful execution, and continuous improvement based on data." - InstantViews Team
Tracking Your Progress
To improve systematically, you need to track your scores over time. Here's how:
- Establish a baseline: Calculate quality scores for your last 10 videos
- Identify patterns: Which factors consistently score low? Which are strengths?
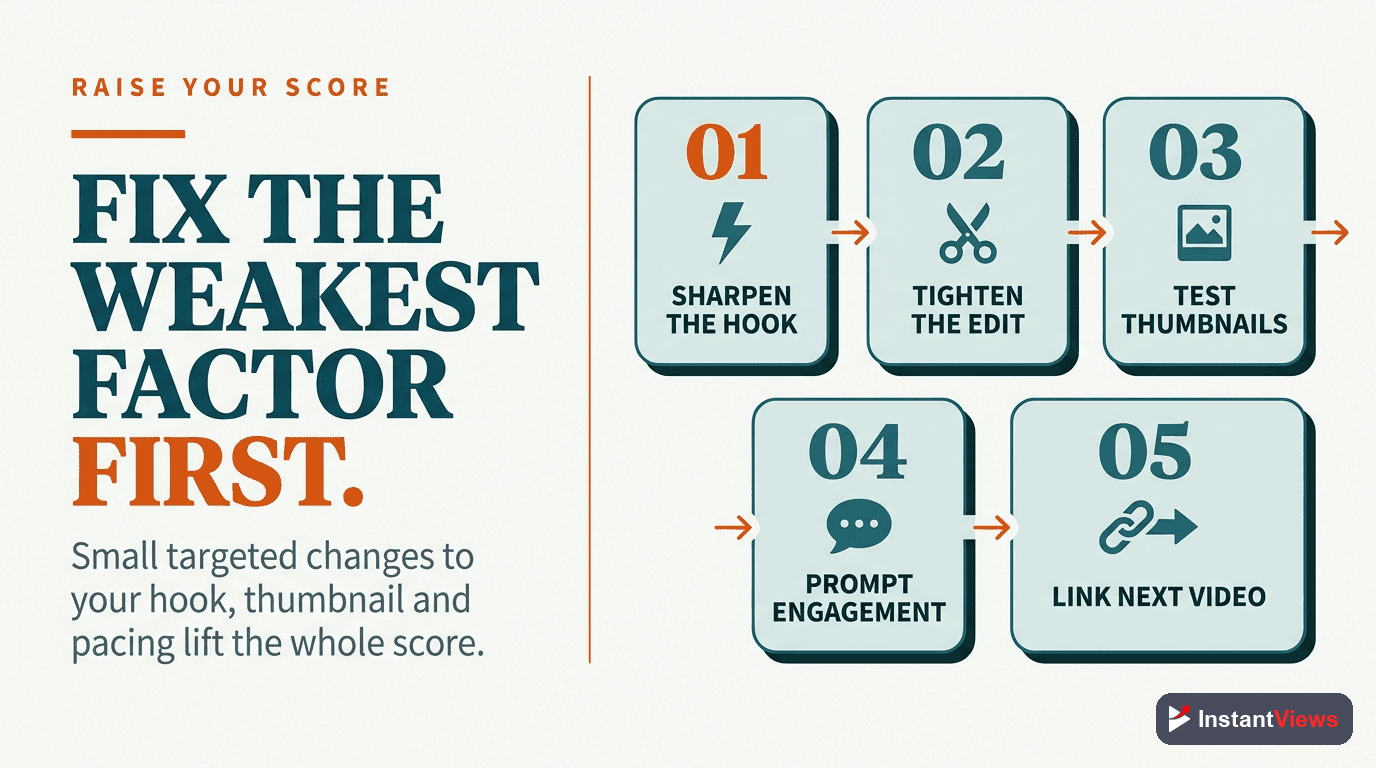
- Set improvement targets: Focus on improving your weakest factor by 5-10 points
- Test changes: Implement improvements one at a time to measure impact
- Review monthly: Track overall score trends and adjust strategy
Common Quality Score Mistakes
Avoid these common errors that hurt quality scores:
- Optimizing for views only: High view counts with low retention hurt more than they help
- Ignoring retention curves: Average retention hides critical drop-off points
- Clickbait thumbnails: High CTR with low satisfaction tanks all other metrics
- Long intros: Viewers drop off before value is delivered
- No CTAs: Missing opportunities for engagement and session extension
- Inconsistent quality: One great video does not matter if the next five are poor
Frequently Asked Questions
A content quality score is a composite metric that evaluates multiple aspects of your video including audience retention, engagement rate, watch time, click-through rate, and viewer satisfaction signals. YouTube uses similar metrics to determine how well your content performs and whether to recommend it to more viewers.
YouTube measures quality through audience behavior metrics like watch time, retention curves, likes-to-views ratio, comment engagement, share rate, and whether viewers watch more of your content after finishing a video. Technical quality (resolution, audio) matters less than viewer engagement and satisfaction.
A quality score above 70/100 is considered good, above 80 is excellent. However, the most important metric is relative performance - how your videos compare to others in your niche. A 75 score in a competitive gaming niche might outperform an 85 in a less competitive educational niche.
Yes, but it is limited. You can improve metadata (title, description, tags), add chapters, create better thumbnails, and pin engaging comments. However, the core content quality is fixed. The best approach is to analyze the score, learn from it, and apply improvements to future videos.
Check quality scores for new videos after 24-48 hours when initial data is available, then weekly for the first month. For established videos, monthly reviews are sufficient. Focus more on trending patterns across multiple videos rather than individual video scores.
Video length itself does not affect scores, but it impacts other metrics that do. Longer videos can generate more watch time but may have lower retention rates. The optimal length depends on your content type and audience expectations. Educational content can be 10-20 minutes, while entertainment might perform best at 8-12 minutes.