- YouTube Studio Analytics provides comprehensive data on views, watch time, engagement, and audience demographics
- The four most important metrics are CTR, Average View Duration, Audience Retention, and Watch Time
- Analytics has four main tabs: Overview, Reach, Engagement, and Audience - each reveals different performance insights
- Real-time analytics (first 48 hours) help you identify early trends and video performance patterns
- Use analytics data to optimize thumbnails, titles, content length, and publishing schedule for better results
YouTube Studio Analytics is the most powerful tool you have as a creator - yet 87% of YouTubers barely scratch the surface of what it can tell them about their channel.
The difference between channels that grow exponentially and those that plateau often comes down to one thing: understanding and acting on analytics data.
This complete guide walks you through every tab, metric, and insight in YouTube Studio Analytics, showing you exactly what to track and how to use that data to grow your channel faster.
Getting Started with YouTube Studio
YouTube Studio Analytics is accessible at studio.youtube.com. Once logged in, click "Analytics" in the left sidebar to access your dashboard.
The analytics interface is divided into several key sections:
- Overview - High-level snapshot of channel performance
- Reach - How viewers discover your content
- Engagement - How viewers interact with your videos
- Audience - Who your viewers are and when they watch
- Revenue - Monetization metrics (for eligible channels)

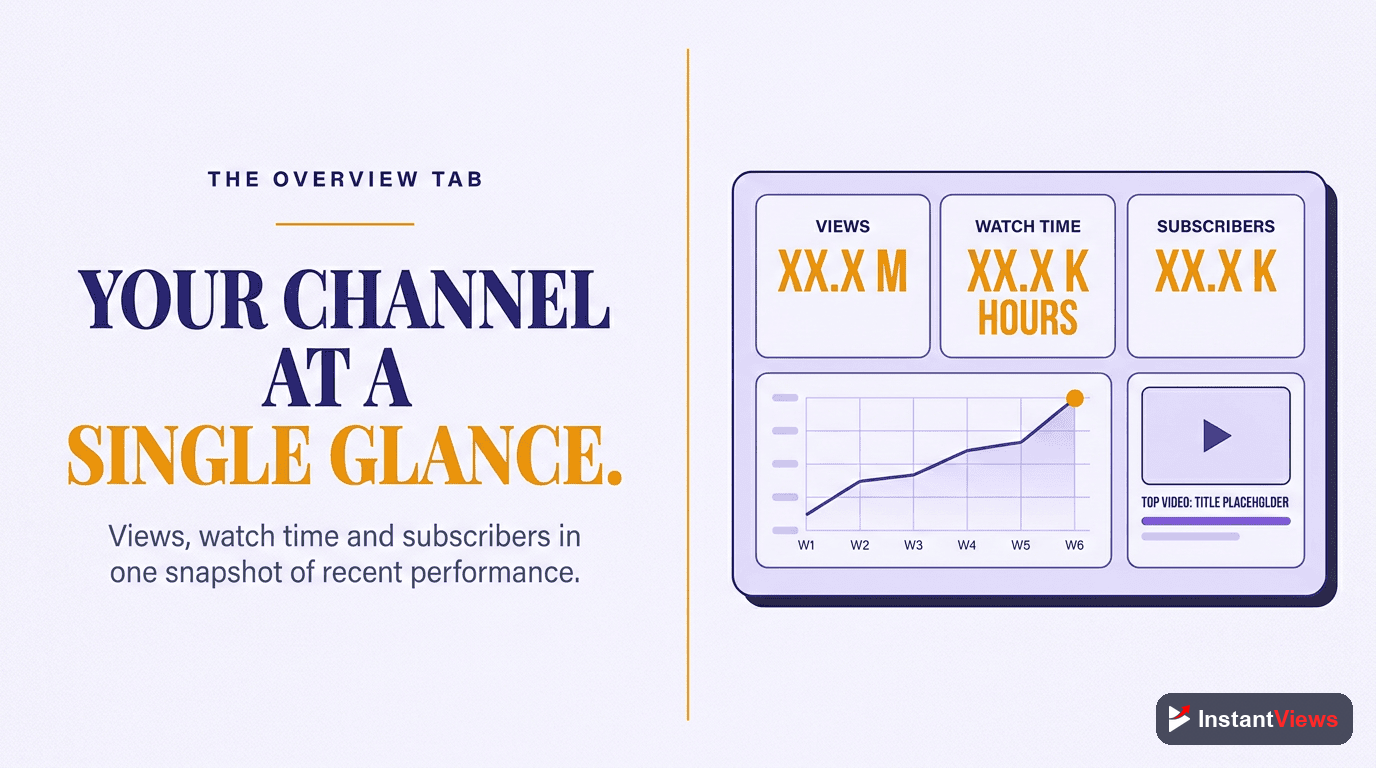
Overview Tab: Your Channel Dashboard
The Overview tab provides a bird's-eye view of your channel's performance. It's designed to answer one question: "How is my channel doing?"
What You'll See
- Views - Total number of times your videos were watched
- Watch Time - Total hours viewers spent watching your content
- Subscribers - Net subscriber change (gains minus losses)
- Estimated Revenue - Earnings from ads (monetized channels only)
Below these primary metrics, you'll find cards showing:
- Your top-performing videos in the selected date range
- Real-time activity (last 48 hours)
- Latest video performance
- Recent subscribers
Don't obsess over views alone. Watch time is what YouTube's algorithm actually cares about. A video with 10,000 views and 50% retention beats a video with 20,000 views and 20% retention every time.
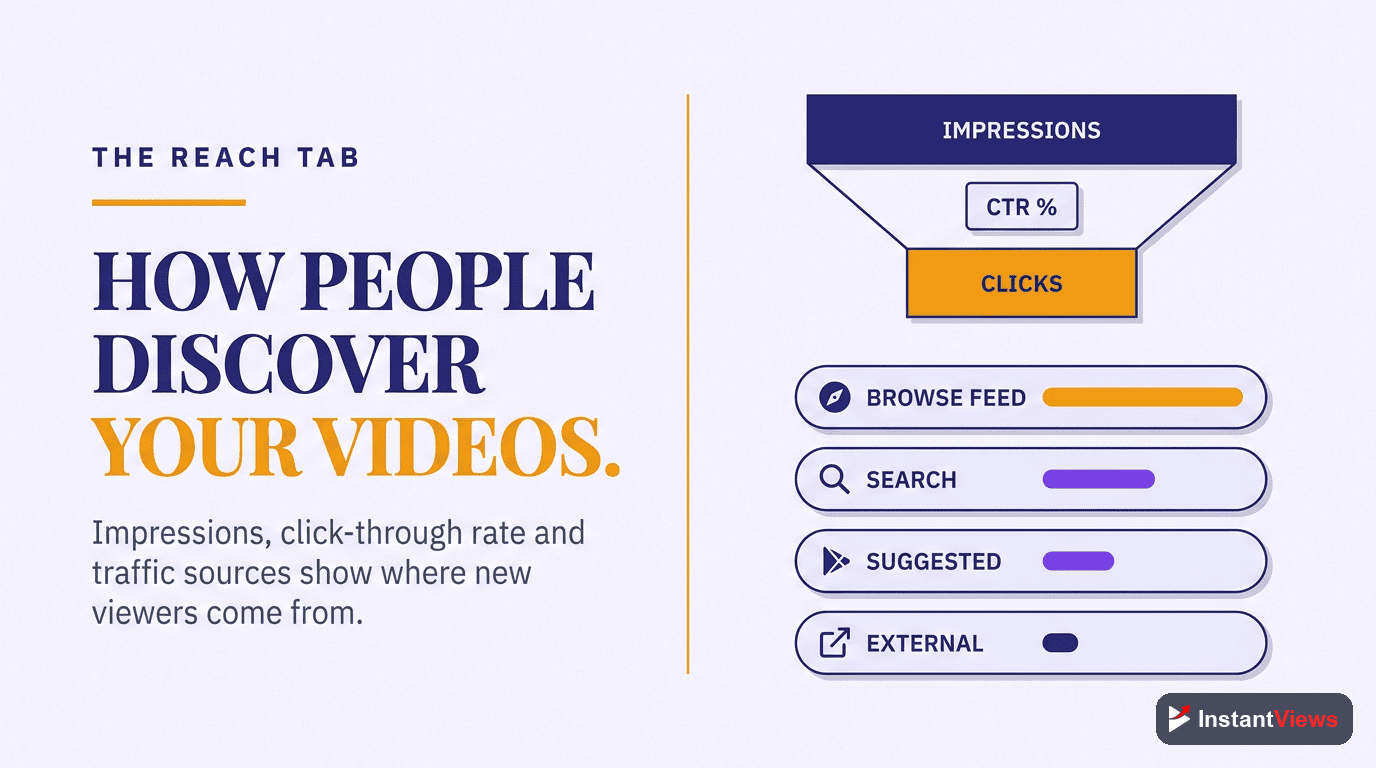
Reach Tab: How People Find Your Videos
The Reach tab answers the critical question: "How are people discovering my content?"
Impressions
The number of times your video thumbnail was shown to viewers on YouTube. This doesn't mean they clicked - just that they saw it.
High impressions with low CTR means your thumbnail/title needs work. Low impressions means YouTube isn't recommending your content widely yet.
Click-Through Rate (CTR)
The percentage of impressions that resulted in a view. This is one of the most important metrics for video performance.
4-10% is solid for most channels. Under 2% means your packaging (thumbnail + title) isn't compelling. Over 10% is exceptional.
Traffic Source Types
This section shows where your views are coming from:
| Traffic Source | What It Means | How to Increase |
|---|---|---|
| Browse Features | Home page and subscription feed | Improve CTR, publish consistently |
| Suggested Videos | Recommended after/alongside other videos | Boost retention, optimize for related content |
| YouTube Search | People searching for specific topics | Better SEO, keyword optimization |
| External | Links from outside YouTube | Promote on social media, embed on websites |
| Playlists | Your playlists or others featuring your video | Create organized playlists, encourage others to add your content |
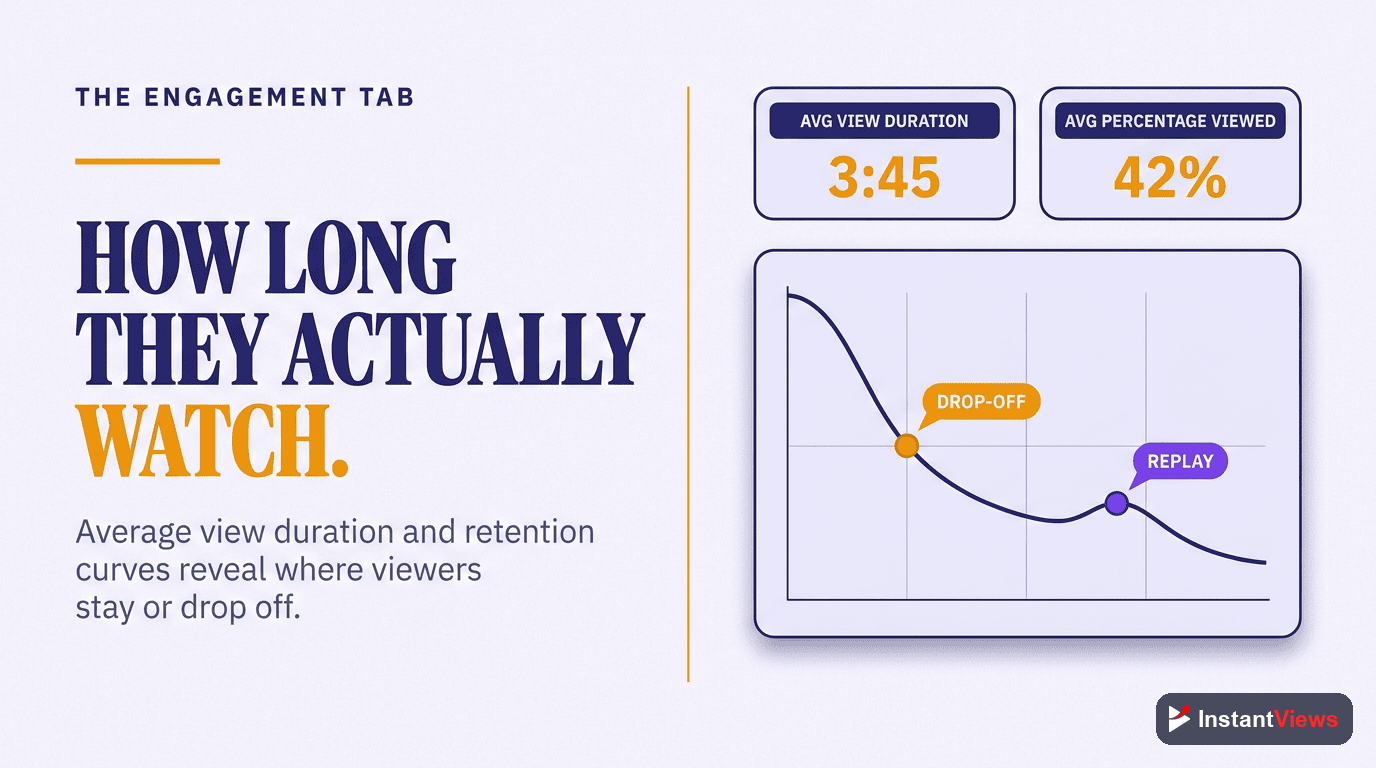
Engagement Tab: How People Watch
The Engagement tab reveals how viewers interact with your content - arguably the most important tab for improving video performance.
Watch Time
The total amount of time viewers spent watching your videos. This is the #1 metric YouTube's algorithm uses to rank and recommend content.
More watch time = more recommendations. A 10-minute video with 50% retention (5 min watch time) beats a 5-minute video with 80% retention (4 min watch time).
Average View Duration
How long, on average, people watch your videos before clicking away. This tells you if your content is holding attention.
40-60% of total video length is solid. Under 40% means you're losing viewers too quickly. Aim to increase this by improving pacing and hooks.
Audience Retention
A graph showing exactly when viewers leave your video. This is the most actionable metric for improving content quality.
Look for sudden drops - these indicate boring sections, broken promises, or pacing issues. The first 30 seconds should retain 70%+ of viewers.
Additional engagement metrics include:
- Likes vs. Dislikes - Sentiment indicator (though dislikes are now hidden from viewers)
- Comments - Community engagement level
- Shares - How often viewers share your content
- Saves to Playlists - Intent to watch later or rewatch
- Cards & End Screens - Click-through rates on your interactive elements
Audience Tab: Who's Watching
Understanding your audience demographics helps you create content that resonates with the people already watching - and attract more like them.
Key Audience Insights
- Age & Gender - Who your content appeals to demographically
- Geography - Where your viewers are located (optimize posting times accordingly)
- Watch Time from Subscribers vs. Non-Subscribers - Are you growing beyond your existing audience?
- When Your Viewers Are on YouTube - Optimal posting times based on when your audience is active
- Other Videos Your Audience Watches - What other channels/content compete for attention
If your watch time is mostly from subscribers, you're not growing. Healthy channels get 60-80% of watch time from non-subscribers, showing YouTube is recommending your content beyond your existing audience.

Revenue Tab: Monetization Insights
For channels in the YouTube Partner Program, the Revenue tab shows:
- Estimated Revenue - How much you've earned
- RPM (Revenue Per Mille) - Earnings per 1,000 views after YouTube's cut
- CPM (Cost Per Mille) - What advertisers pay per 1,000 impressions
- Playback-Based CPM - CPM from monetized playbacks only
- Revenue Sources - Breakdown of ads, memberships, Super Chat, etc.
Different content types have different CPMs. Finance, business, and tech typically earn $8-15 CPM, while gaming and entertainment average $2-5 CPM.
6 Key Metrics That Matter Most
While YouTube provides dozens of metrics, these six drive channel growth:
| Metric | Why It Matters | Target |
|---|---|---|
| Click-Through Rate | Determines if people want to watch | 4-10% |
| Average View Duration | Shows content quality and relevance | 40-60% of length |
| Audience Retention | Reveals exactly where you lose viewers | 70%+ at 30 seconds |
| Watch Time | Primary algorithm ranking factor | Higher is always better |
| Traffic Source: Suggested | Indicates algorithm is recommending you | 30-50% of views |
| Subscriber Watch Time % | Shows if you're reaching new audiences | 20-40% (lower = more reach) |
"Data is the difference between guessing and knowing. Every successful creator I know makes decisions based on their analytics, not hunches." - Paddy Galloway, YouTube Strategy Expert
Using Analytics to Grow Your Channel
Week 1: Identify Your Best Content
Look at your top 10 videos by watch time in the last 90 days. Ask:
- What topics performed best?
- What thumbnail/title styles got the highest CTR?
- What video length had the best retention?
- Where did traffic come from?
Action: Create more content similar to your top performers.
Week 2: Fix Your Weak Points
Identify your biggest weakness:
- CTR under 3%? - Improve thumbnails and titles
- Retention under 40%? - Work on hooks and pacing
- Low watch time from non-subscribers? - Optimize for search and suggested videos
Action: Focus on improving one metric at a time.
Week 3: Optimize Publishing Schedule
Check "When your viewers are on YouTube" in the Audience tab.
Action: Schedule uploads 1-2 hours before your peak viewing times.
Week 4: Test and Iterate
Run A/B tests on:
- Thumbnail styles (faces vs. text vs. visual metaphors)
- Title formulas (questions vs. statements vs. how-tos)
- Video length (short-form vs. long-form)
- Content formats (tutorials vs. commentary vs. storytelling)
Analyze Before You Upload
Get instant video scores and optimization suggestions before publishing with our Video Analyzer tool.
Try Video Analyzer →Advanced Analytics Tips
- Use the "Compare to" feature - See how a video performs against your channel average
- Filter by traffic source - Understand performance differences between search, suggested, and browse traffic
- Check mobile vs. desktop - Different devices have different retention patterns
- Monitor subscriber sources - Which videos convert viewers to subscribers most effectively?
- Track seasonal trends - Compare year-over-year to understand cyclical patterns
Common Analytics Myths Debunked
Myth: "More subscribers means more views"
Truth: Subscribers only see 10-20% of your uploads in their feed. Views come from non-subscribers via suggestions and search.
Myth: "I need to make my videos shorter"
Truth: Longer videos often perform better because total watch time is what matters. A 20-minute video with 40% retention beats a 5-minute video with 60% retention.
Myth: "High CTR is always good"
Truth: If CTR is high but retention is low, you're clickbaiting. The title/thumbnail promises something the video doesn't deliver.

Frequently Asked Questions
YouTube Studio Analytics is the built-in analytics dashboard that provides comprehensive data about your channel and video performance. It tracks views, watch time, subscriber growth, revenue, audience demographics, traffic sources, and engagement metrics - everything you need to understand and grow your channel.
The most critical metrics are Click-Through Rate (CTR), Average View Duration, Audience Retention, and Watch Time. These four metrics directly influence how YouTube recommends your videos. A good CTR is 4-10%, and retention above 50% is considered strong.
Check your analytics at least weekly for active channels. Review real-time data within 48 hours of publishing to catch early performance trends. Do a deep monthly analysis to identify patterns and adjust your content strategy accordingly.
For most content, 40-60% average retention is solid. Educational content often sees 50-70%, while entertainment may be 30-50%. The key is the retention curve - if viewers drop off in the first 30 seconds, your hook needs work.
In YouTube Studio, go to Analytics > Content tab > Sort by Watch Time or Views. Also check the "Top Videos" card on the Overview page. Look beyond views - analyze CTR, retention, and engagement to understand why certain videos perform better.
Absolutely. Analytics reveals what content resonates, where viewers come from, when they watch, and why they leave. Use this data to optimize thumbnails, titles, video length, posting schedule, and content topics. The InstantViews Video Analyzer complements this by scoring videos before you publish.