- Retention rate is the percentage of your video the average viewer actually watches — the clearest signal of whether your content is worth watching
- In 2026, retention is the quality behind watch time: a 6-minute video at 80% retention beats a 20-minute video at 30%, even though the longer one logs more raw minutes
- The retention graph tells a story — an early cliff means a weak hook, mid-video dips mean dead air, and spikes mark moments viewers loved
- High retention drives recommendations because YouTube promotes videos it predicts viewers will be satisfied with
- You improve retention with strong hooks, pattern interrupts, tight pacing, open loops, and ruthless removal of dead air
Every creator obsesses over views. They are the number on the thumbnail, the figure that feels like success or failure. But views are only the front door. What happens after the click — whether a viewer stays for ten seconds or ten minutes — is what actually decides how far a video travels. That after-the-click behaviour has a name: audience retention.
With more than 2.7 billion monthly active users and over a billion hours of video watched every day, YouTube has near-infinite content to choose from when it decides what to put in front of someone. Its job is to predict which video a given viewer will be most satisfied with. The strongest clue it has is brutally simple: how long did previous viewers stay? That is why retention has quietly become the metric that matters most.
This guide breaks down exactly what retention rate is, how to read the retention graph like a map of attention, why retention now outweighs raw watch time, how it feeds the recommendation engine, and the concrete techniques you can use to keep viewers watching longer in 2026.
- What Is YouTube Retention Rate?
- Retention vs. Raw Watch Time
- Reading the Retention Graph
- How Retention Drives Recommendations
- What Counts as Good Retention?
- Fixing the Hook: The First 30 Seconds
- Techniques to Keep Viewers Watching
- Retention Troubleshooting Table
- A Five-Step Retention Workflow
- Common Retention Mistakes
- FAQ
What Is YouTube Retention Rate?
Audience retention rate is the percentage of a video that the average viewer actually watches. If your typical viewer makes it through five minutes of a ten-minute video, your retention rate is roughly 50 percent. It is a measure of how well your content holds attention from the first frame to the last.
YouTube does not report retention as a single dry number. It shows it as a graph that runs the full length of your video, plotting the percentage of viewers still watching at every moment. That graph is one of the most honest pieces of feedback you will ever get, because it shows you precisely where people stay glued and precisely where they reach for the back button.
There are two flavours worth knowing. Absolute retention shows the raw shape of attention across one video. Relative retention compares your video against other videos of a similar length on YouTube, so you can see whether your opening holds up better or worse than average. Both matter, but the absolute graph is where you do most of your detective work.
Why Retention Is Different From Views
Views tell you how many people decided to click. Retention tells you whether that click was worth it. A clickbait title can manufacture views, but it cannot manufacture retention — if the content does not deliver, the graph collapses within seconds and YouTube notices. That is exactly why retention has become such a trusted signal: it is very hard to fake.

Retention vs. Raw Watch Time
For years, the advice was simple: maximise watch time, the total number of minutes people spend on your videos. That advice was not wrong, but it was incomplete, and it led a lot of creators to pad their videos to artificial lengths chasing minutes that nobody actually wanted to watch.
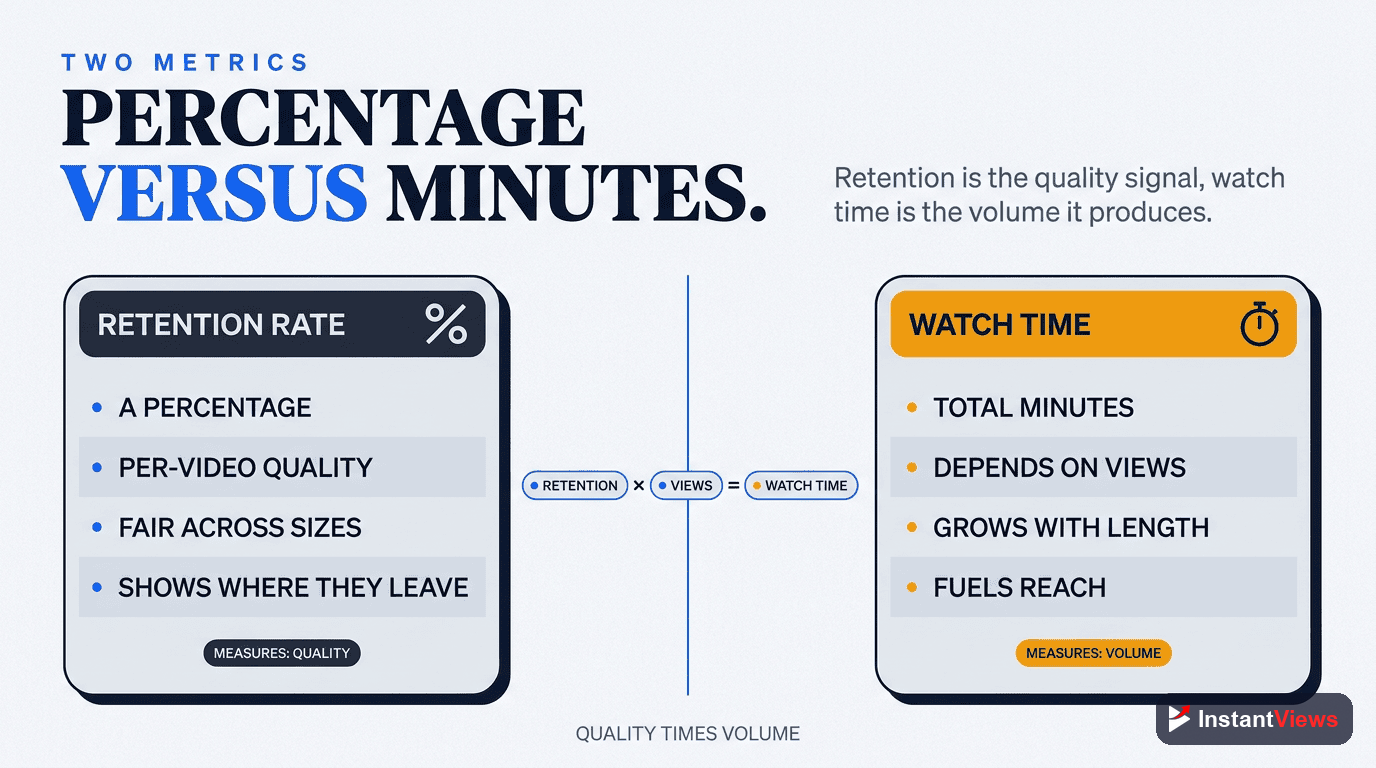
The nuance that matters in 2026 is this: retention is the quality behind watch time. YouTube weights how long viewers stay relative to the length of the video, not just the absolute minutes. A video that holds the vast majority of its audience all the way through tells the algorithm something a bloated video never can — that people found it genuinely satisfying.
The cleanest way to see this is with a head-to-head. Consider two videos competing for the same slot in the suggested feed:
- Video A: 6 minutes long, holds 80 percent of its audience to the end. Average viewer watches nearly 5 minutes and leaves satisfied.
- Video B: 20 minutes long, holds only 30 percent of its audience. Average viewer watches 6 minutes, then bails out of boredom.
Video B technically logs slightly more raw minutes per viewer, but Video A sends the far stronger signal. It tells YouTube that almost everyone who started it stayed to the end — the hallmark of a satisfying watch. The padded video, by contrast, signals that most people gave up. In a satisfaction-first system, the tight 6-minute video wins the recommendation battle.
Reading the Retention Graph
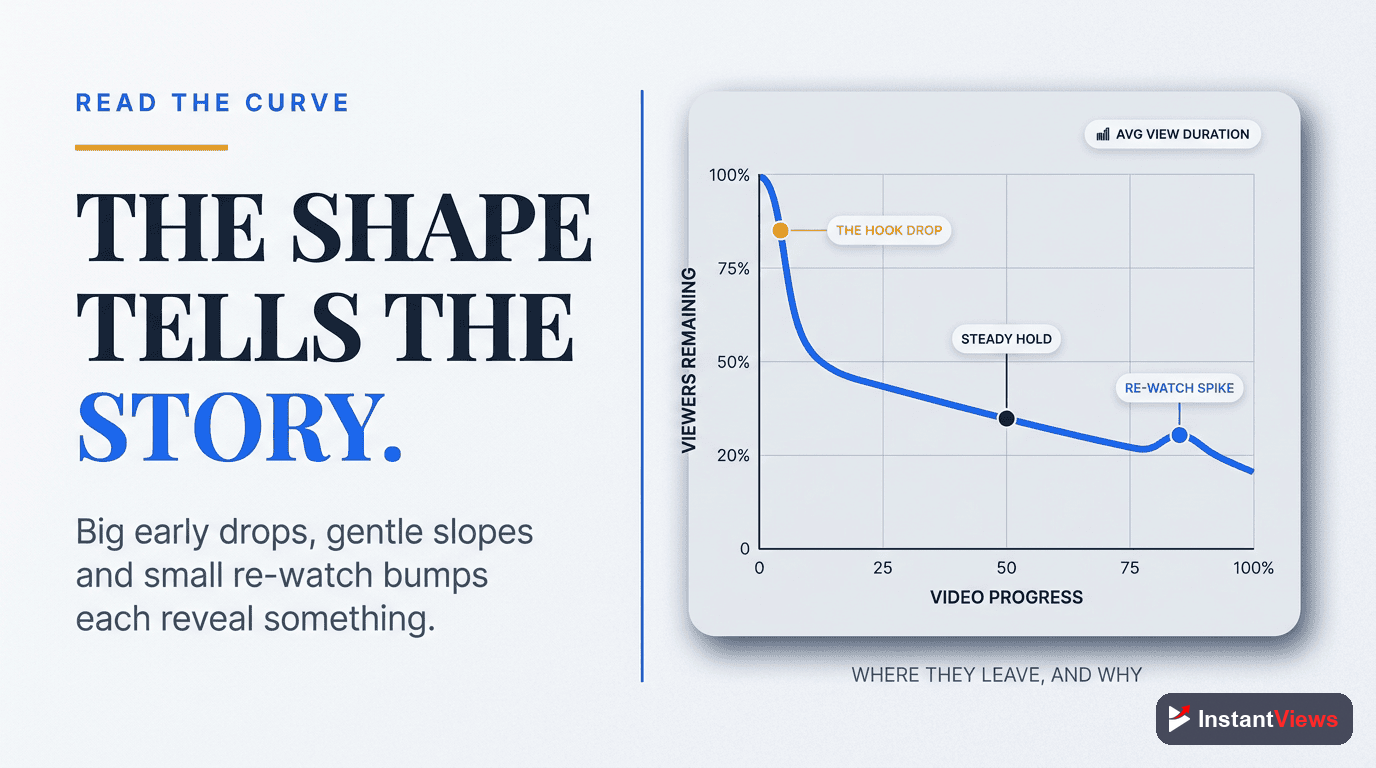
The retention graph is a map of attention, and it speaks in three basic shapes. Learn to read them and you will know exactly what to fix without guessing.
The Intro Drop (the opening cliff)
Almost every video has its steepest drop in the first 30 seconds. This is normal — some people clicked by mistake or were just browsing — but the size of that drop is the single most important number on the whole graph. A gentle slope means your hook is doing its job. A sheer cliff means viewers arrived, did not get what the title promised fast enough, and left. The opening is where you win or lose the most attention.
Mid-Video Dips (the leaks)
Sudden downward steps in the middle of the graph mark the exact moments viewers tuned out: a tangent, a slow re-explanation, a stretch of dead air, or a point that dragged. Each dip is a precise instruction telling you what to cut next time. If several videos dip at the same kind of moment — say, whenever you start a long backstory — that is a pattern worth eliminating.
Spikes and Plateaus (the wins)
An upward spike means viewers rewound to watch something again, often a key demonstration, a surprising visual, or a quotable line. A long flat plateau means people are staying steady — the content is carrying them. Spikes and plateaus are gold: they tell you what your audience genuinely values so you can do more of it.
Do not judge a video by retention alone in the first hours after publishing. Early viewers are usually your most loyal subscribers, who watch longer than the broader audience the algorithm later tests. Let the data settle before drawing conclusions, and always compare a video against others of similar length, not against a single universal target.
How Retention Drives Recommendations
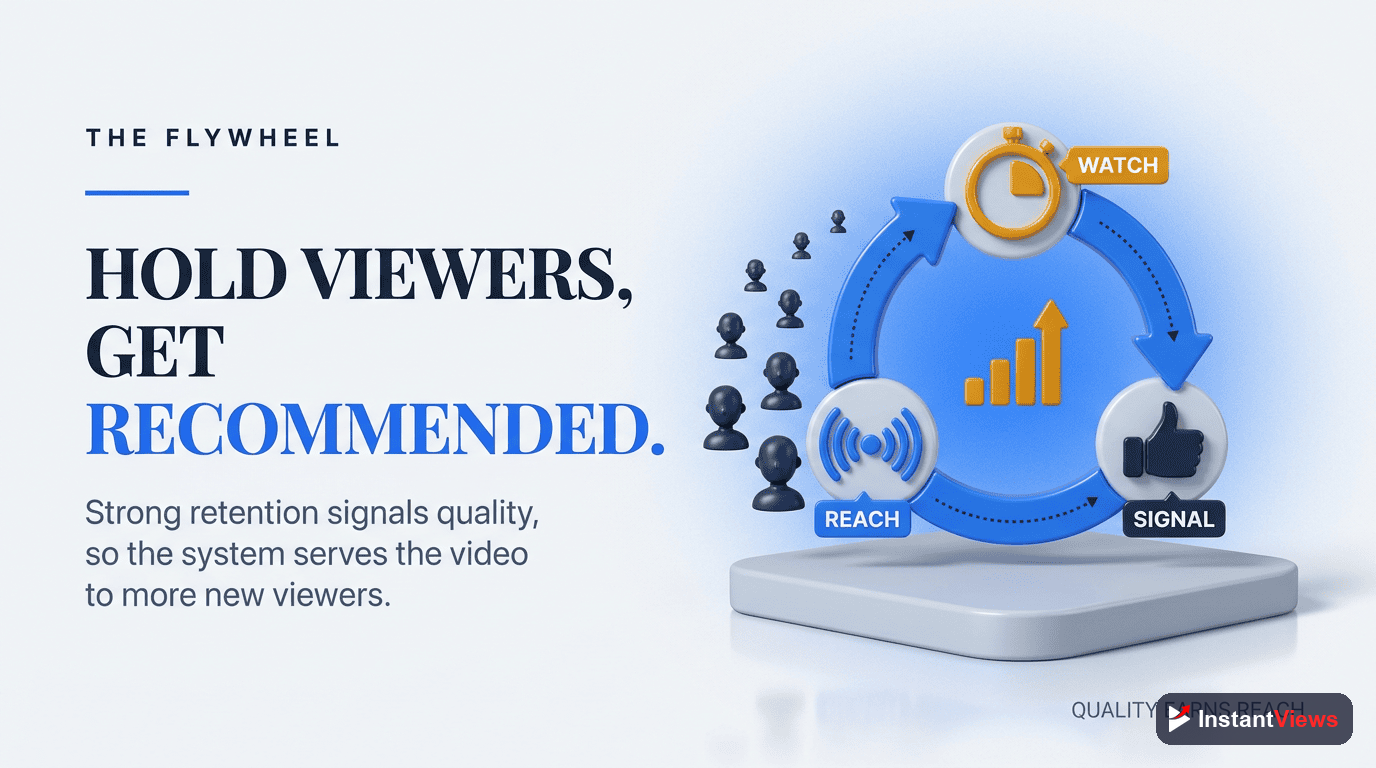
To understand why retention matters so much, you have to understand what YouTube is actually trying to do. The recommendation system is, at its core, a satisfaction prediction engine. Every time it considers showing your video to someone, it is making a bet: will this person be glad they watched? The more confident it is, the more often it shows your video in suggested videos, search results, and the home feed.
The strongest evidence it has for that bet is the behaviour of everyone who watched before. If they stayed, finished, and went on to watch more, that is a powerful vote of confidence. If they bailed in the first ten seconds, that is a warning. Retention is the raw material the prediction engine runs on.
This is why retention compounds. A video that holds attention earns more impressions; more impressions bring more views; more views from satisfied viewers reinforce the signal; and the cycle feeds itself. The flywheel is the reason a single strong video can keep pulling in views for months, long after you have moved on.
It also explains why so many creators feel stuck. A channel can publish constantly and still stall if every video leaks attention in the same places. Fixing retention is often the difference between a channel that plateaus and one that breaks out — the upload schedule did not change, the holding power did.
What Counts as Good Retention?
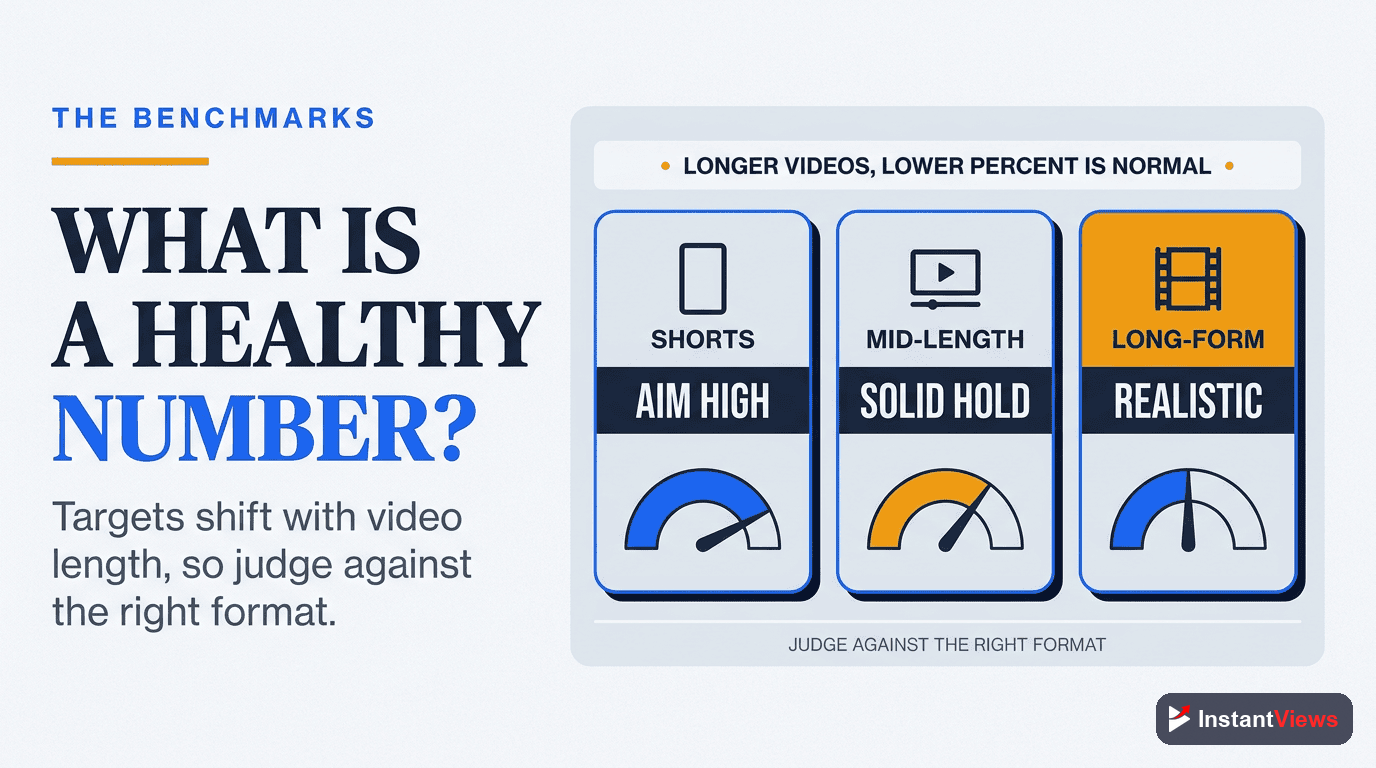
There is no single magic number, because retention varies enormously by format and topic. That said, some general guideposts help you judge whether a video is healthy.
- 40 to 60 percent average retention is a healthy range for most videos. Land consistently in that zone and your content is holding attention well.
- Tutorials and how-to videos often run a little lower, around 45 to 55 percent, and that is perfectly fine. Viewers leave the moment they find the specific answer they came for.
- Story-driven and entertainment content can hold much higher, because the payoff lives at the end and viewers stay for the resolution.
This is where the idea of good abandonment comes in. If someone searches "how to reset a router," watches your 90-second fix, solves their problem, and leaves, that early exit is a success, not a failure. The 2026 algorithm increasingly recognises this kind of satisfied departure and does not punish a video for solving a problem quickly. The lesson: judge retention against the intent of your content, not against an arbitrary universal benchmark.
Fixing the Hook: The First 30 Seconds
If you only fix one thing, fix your opening. The first 30 seconds carry more weight than any other part of your video because that is the window in which viewers decide whether to commit. A weak hook is the most common reason an otherwise good video underperforms.
The diagnosis is easy. Open your retention graph and look at where the line sits at the 30-second mark. If a large share of viewers have already left, your hook — not your topic, not your editing later on — is the bottleneck. Here is how to rebuild it:
- Cut the padding. Remove logo animations, long welcomes, "before we start, smash that subscribe" reminders, and channel trailers from the opening. They burn the most valuable seconds you have.
- Match the click instantly. Whatever your title and thumbnail promised, show it or name it in the first few seconds. Confirm the viewer is in the right place before they doubt it.
- Start mid-action. Open with a result, a moment, or a striking visual that is already happening. Curiosity holds attention far better than a slow build-up.
- Design for sound-off, mobile viewing. Many viewers start a video on a phone without sound. Strong on-screen text and visuals make your opening land even before the audio kicks in.

Techniques to Keep Viewers Watching
A strong hook gets viewers in. These techniques keep them there for the rest of the video, smoothing out the mid-video dips that quietly bleed away your retention.
Pattern Interrupts
Attention naturally fades on anything that feels static. A pattern interrupt resets it: a hard cut, a change of camera angle, a graphic appearing on screen, a shift in tone or pace, a quick b-roll insert. Sprinkle these throughout so the video never settles into a monotonous rhythm that invites the viewer to drift away.
Open Loops
An open loop is a promise you make early and pay off later: "I will show you the mistake almost everyone makes — but first, the setup." It plants a reason to keep watching past the current section. Stack a few of these and viewers stay because they are waiting for the payoff you teased.
Tight Pacing and No Dead Air
Dead air is the silent killer of retention — the pauses, the "ums," the slow re-explanations, the repeated points. In editing, be ruthless: cut anything that does not move the video forward. If a sentence can go without changing the meaning, it should go. Tighter pacing keeps energy high and gives viewers fewer natural exit points.
Deliver on the Promise, Then Stop
Once you have given viewers what the title promised, do not pad the ending with filler. A clean, confident finish leaves a better last impression than a rambling outro — and it trains viewers to trust that your videos respect their time.

Retention Troubleshooting Table
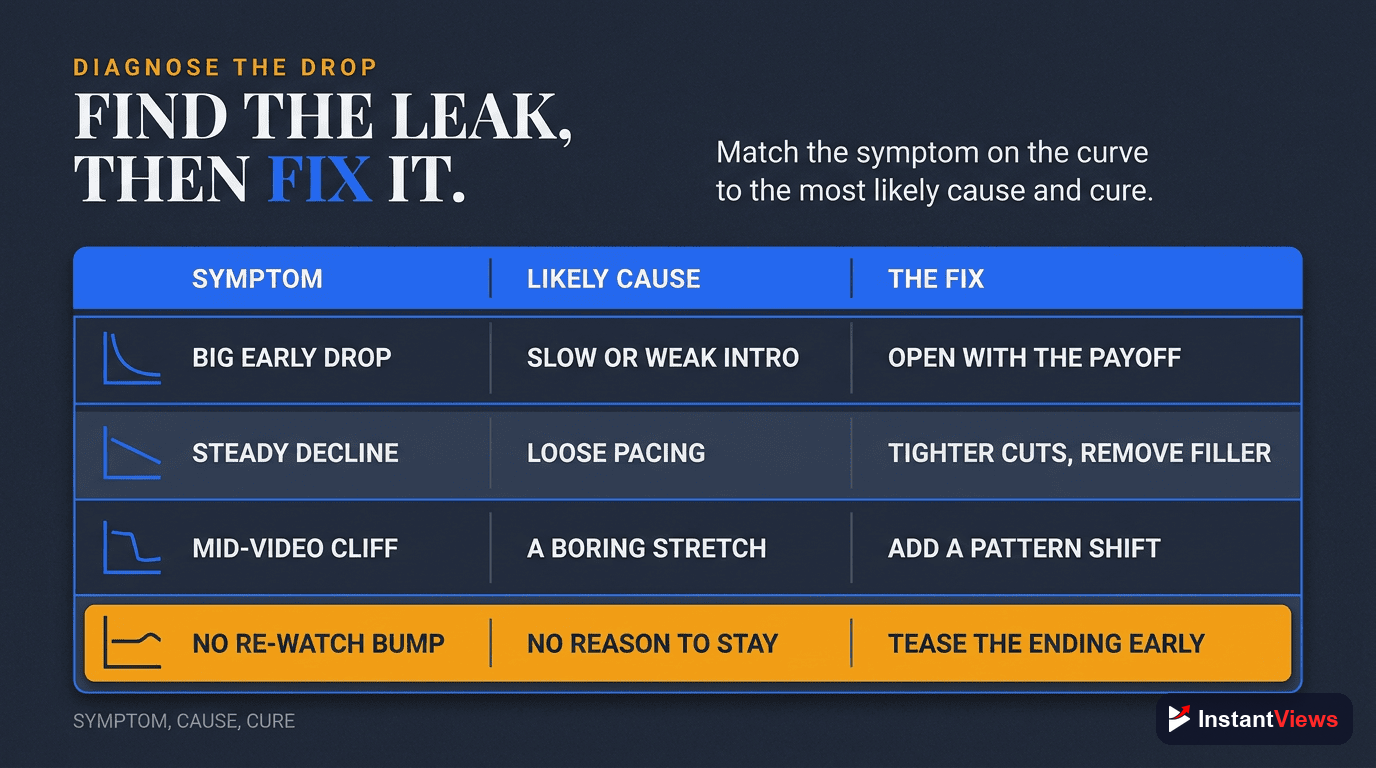
When your retention graph shows a problem, the shape of that problem usually points straight to the cause. Use this table to translate what you see into what to fix.
| Retention Problem | Likely Cause | The Fix |
|---|---|---|
| Steep cliff in the first 30 seconds | Weak hook; slow intro; title and content mismatch | Cut the logo and welcome, match the thumbnail promise instantly, open mid-action |
| Sudden dip mid-video | Tangent, dead air, or a section that drags | Edit out the dip moment; tighten or remove the slow segment in future cuts |
| Slow, steady decline throughout | Pacing too slow; not enough pattern interrupts | Add cuts, visuals, and tone changes; reset attention every few seconds |
| Big drop right before a key point | Too much build-up before the payoff | Use open loops and get to the valuable part sooner |
| Sharp drop at the end | Long outro, filler, or repeated calls to action | Trim the ending; end shortly after you deliver the promise |
| Low retention on long videos only | Video is longer than the topic justifies | Make it as long as it needs to be and no longer; cut to the high-retention length |
A Five-Step Retention Workflow
Turning retention into a habit is simpler than it sounds. Run this short loop after every upload and your graphs will climb over time.
Open the Retention Graph
In YouTube Studio, open the audience retention report for the video. Note the size of the opening drop, any mid-video dips, and any spikes.
Diagnose the Biggest Leak
Find the single worst moment — usually the steepest drop — and use the troubleshooting table to identify its likely cause. Fix the biggest leak first.
Rebuild the Hook
On your next video, cut the intro padding, match the title and thumbnail in the first seconds, and open with a result or a striking moment.
Tighten the Middle
Edit out the dead air and tangents you found, add pattern interrupts, and plant open loops to pull viewers forward through each section.
Compare and Repeat
Check whether the new video holds attention better than the last. Keep the techniques that work, drop the ones that do not, and run the loop again.
Grow Your Channel Faster
Explore our free suite of YouTube tools to research topics, sharpen your titles and thumbnails, and analyze what is keeping viewers watching.
Explore Free YouTube Tools →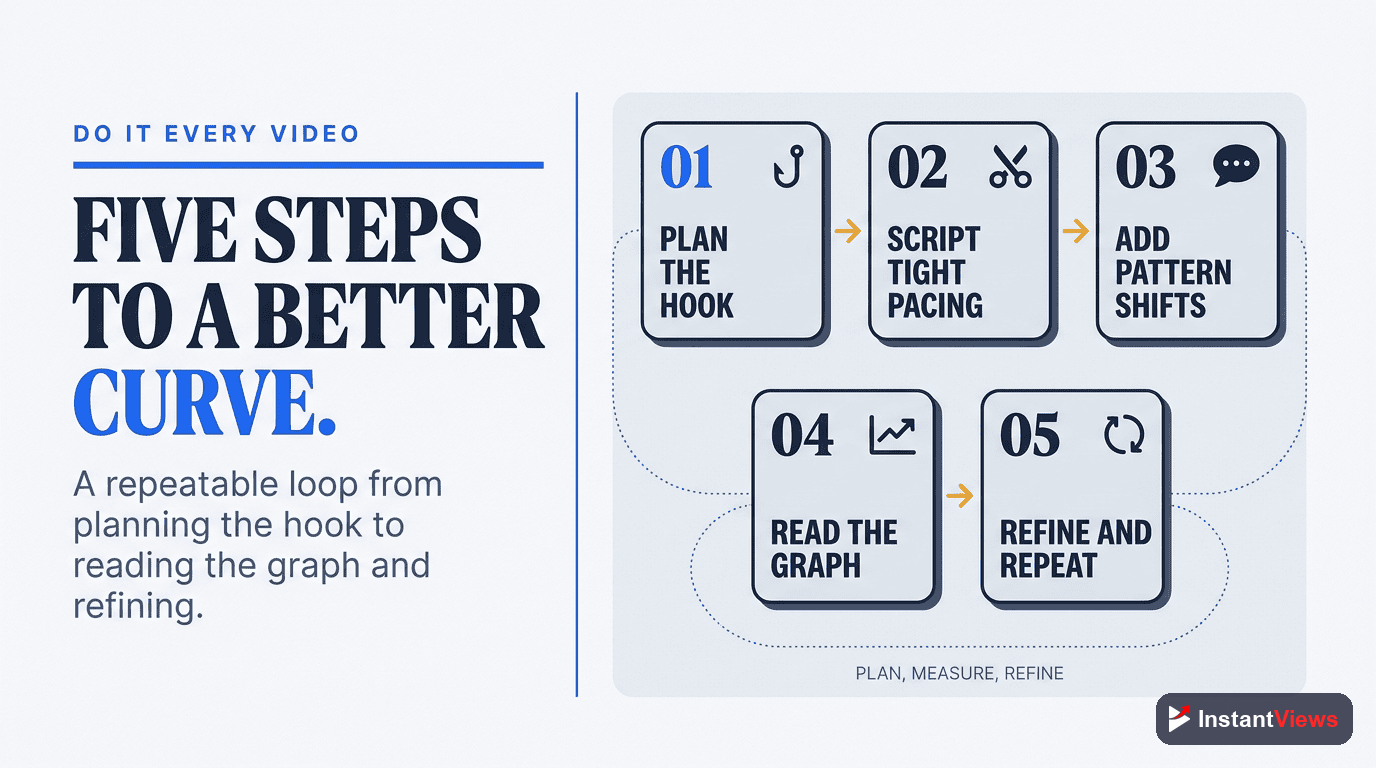
Common Retention Mistakes
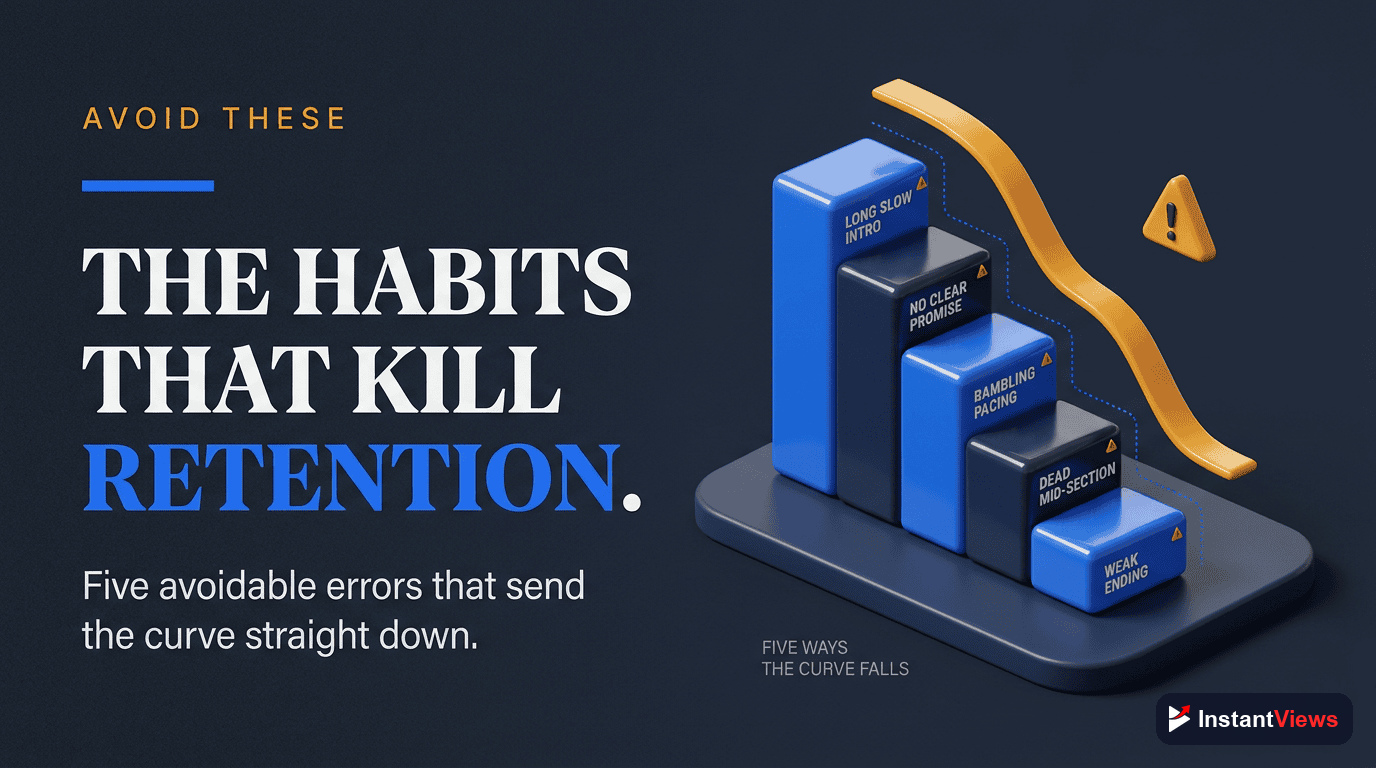
Even experienced creators sabotage their own retention without realising it. Watch out for these recurring traps:
- Front-loading housekeeping: Subscribe reminders, sponsor reads, and long intros in the first 30 seconds chase away the viewers you just earned. Move them later, after you have delivered value.
- Padding for length: Stretching a video to hit an arbitrary runtime almost always tanks retention. Density beats duration every time.
- Burying the payoff: Making viewers wait too long for the thing they clicked for. Tease it early and deliver it before patience runs out.
- Ignoring the graph: Publishing video after video without ever reading the retention report means repeating the same mistakes forever.
- Comparing to the wrong benchmark: Panicking because a 90-second how-to has lower retention than a 12-minute story. Different formats live in different ranges — judge against intent.
- Chasing watch time over satisfaction: Optimising for raw minutes instead of whether viewers actually enjoyed the watch. In 2026, satisfaction is the signal that scales.
The thread running through all of these is the same: respect the viewer's time. Every technique in this guide — the hook, the pattern interrupts, the open loops, the ruthless editing — is really just a way of proving, second by second, that the next moment is worth staying for.
"Views measure curiosity. Retention measures trust. Earn the second and the first takes care of itself — because YouTube keeps recommending the videos people actually finish."
Frequently Asked Questions
Audience retention rate is the percentage of a video that the average viewer actually watches. If your average viewer makes it through 5 minutes of a 10-minute video, your retention rate is roughly 50 percent. YouTube measures it as a graph across the whole video, so you can see exactly where viewers stay and where they leave.
They work together, but retention is the quality signal behind watch time. A 6-minute video that holds 80 percent of its audience sends a far stronger satisfaction signal than a 20-minute video that holds only 30 percent, even though the longer video may rack up more raw minutes. YouTube weights how long viewers stay relative to the video length, so high retention beats long-but-ignored runtime.
For most videos, a healthy average retention sits in the 40 to 60 percent range. Tutorials and how-to videos often land lower, around 45 to 55 percent, because viewers leave once they find the answer they came for, which is perfectly healthy. Compare your videos against your own channel and against videos of similar length rather than chasing a single universal number.
The opening is where the biggest drop almost always happens because viewers are deciding whether the video matches the promise of the title and thumbnail. A slow logo animation, a long welcome, or a vague introduction gives them a reason to leave. The fix is to deliver value or a clear payoff promise within the first few seconds.
The retention graph plots the percentage of viewers still watching at each moment of the video. A steep drop at the start signals a weak hook. Sudden dips in the middle mark dead air, tangents, or repeated points where viewers tune out. Spikes or flat plateaus show moments viewers rewatched or stayed glued to. Read it like a map of attention and fix the dips.
Yes. YouTube tries to predict which videos a viewer will be satisfied with, and how long previous viewers stayed is one of the strongest signals it uses. Videos that hold attention earn more impressions in suggested videos, search, and the home feed, which compounds into more views over time.
Not automatically. The goal is to make every video exactly as long as it needs to be and no longer. Cutting filler, tangents, and dead air almost always lifts retention. If your topic genuinely needs 20 minutes, keep it 20 minutes but make every minute earn its place. A tight 8-minute video usually beats a padded 15-minute one.
Good abandonment describes a viewer who leaves because they got exactly what they came for, such as a quick fix or a single fact. The 2026 algorithm increasingly recognises this kind of exit as a success rather than a failure, so a how-to video that solves a problem fast is not punished for its lower average retention.
Conclusion
Audience retention is the single clearest signal of whether your content is actually worth watching, and in 2026 it sits at the heart of how YouTube decides which videos to recommend. Views get you onto the scoreboard, but retention is what keeps you there — a 6-minute video that holds 80 percent of its audience does more for your channel than a 20-minute video that holds 30 percent, even though the longer one technically logs more minutes.
The path forward is refreshingly practical. Open your retention graph, find the steepest drop, and fix that one moment first. Rebuild a weak hook, cut the dead air, add pattern interrupts and open loops, and make every video exactly as long as it needs to be and no longer. Each small win compounds, because higher retention earns more impressions, and more impressions feed more views.
Treat retention as a habit, not a one-time project. Read the graph after every upload, learn what your specific audience stays for, and let those patterns shape your next video. Do that consistently and you stop guessing why some videos take off — you start engineering it.