- YouTube Analytics provides retention graphs showing chapter engagement patterns
- You can identify which chapters viewers skip to by analyzing retention spikes
- Chapter performance affects watch time, AVD, and algorithm recommendations
- Third-party tools like TubeBuddy and VidIQ offer enhanced chapter analytics
- A/B testing chapter titles and placement improves performance over time
You've added chapters to your YouTube videos. Great first step. But now what? How do you know if your chapters are actually working? Which chapters do viewers engage with? Where do they skip to?
Understanding chapter analytics is the difference between having chapters and having chapters that drive measurable results. In this comprehensive guide, we'll walk through every aspect of YouTube chapter analytics—from native Studio tools to third-party platforms—so you can make data-driven decisions about your video structure.
Let's turn your chapter strategy from guesswork into a precise, optimized system.
YouTube Studio Analytics Overview
YouTube Studio provides several analytics features that reveal chapter performance, though none are explicitly labeled "chapter analytics."
Key Metrics for Chapter Analysis
Where to find them: YouTube Studio → Videos → Select video → Analytics tab
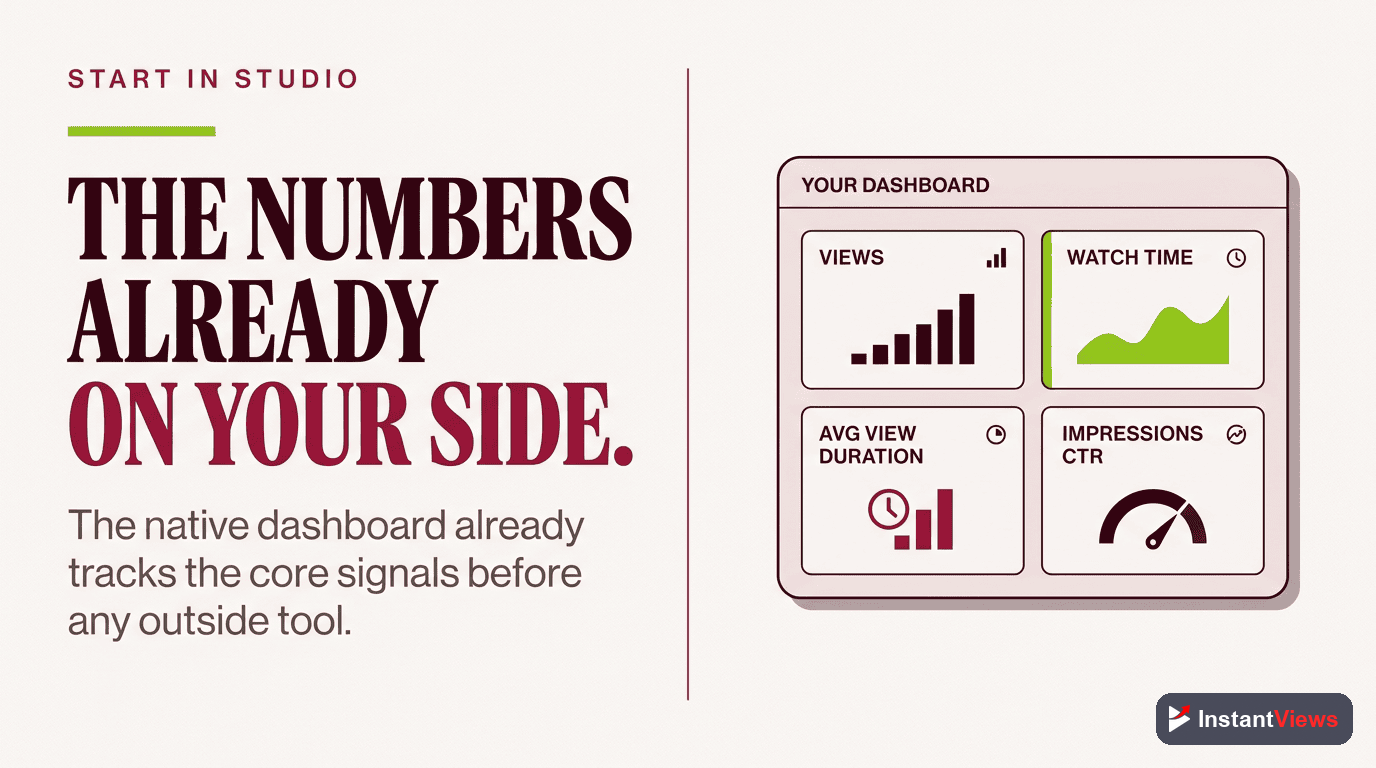
Primary metrics to track:
- Audience Retention: Shows percentage of viewers at each timestamp
- Average View Duration (AVD): How long viewers watch on average
- Total Watch Time: Cumulative viewing hours
- Most Replayed: Segments viewers rewatch (often correlates with valuable chapters)
- Impressions & CTR: How chapters affect thumbnail/title performance
Accessing Chapter-Relevant Data
Navigate to Video Analytics
Focus on Engagement Tab
Enable Date Comparison
Reading the Retention Graph
The audience retention graph is your most powerful tool for understanding chapter performance. Here's how to read it:
Understanding Retention Patterns
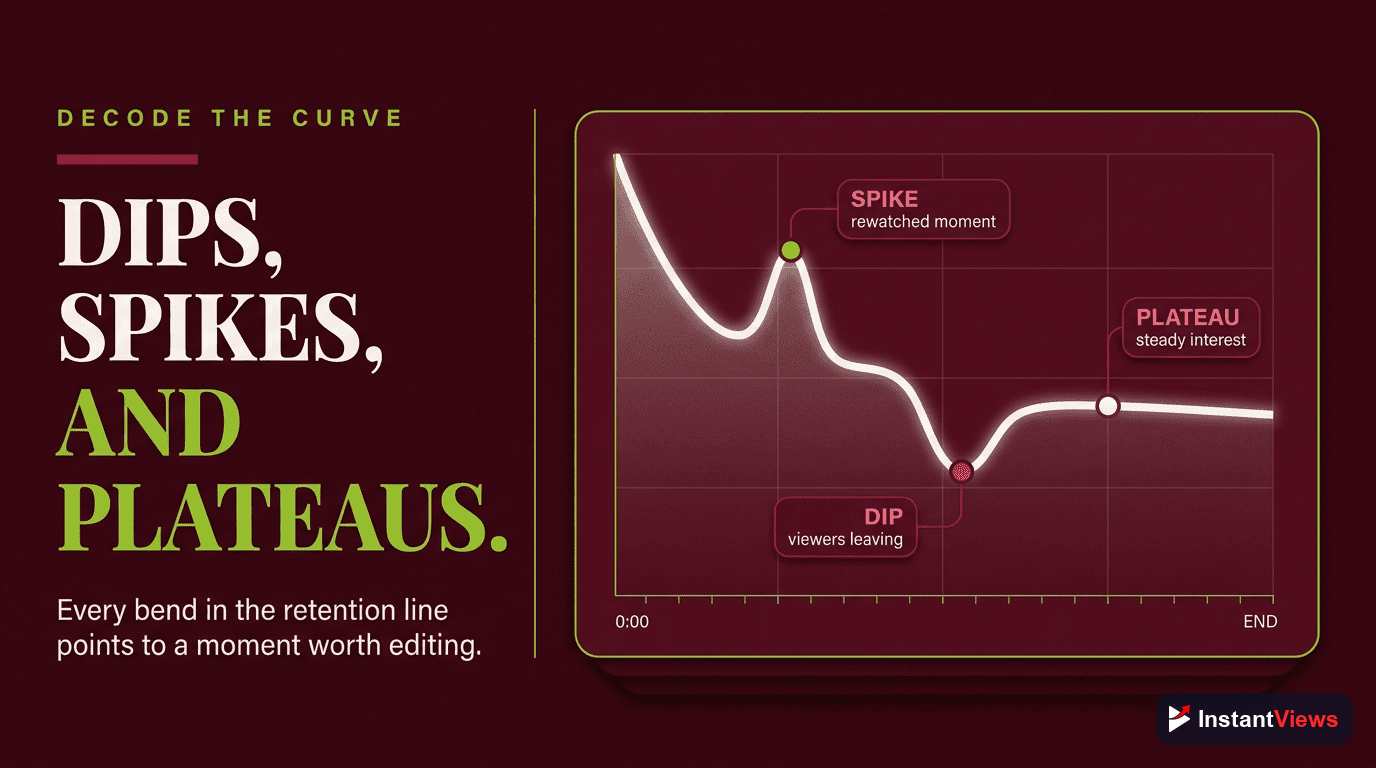
The retention curve shows what percentage of viewers are still watching at any given timestamp. With chapters, you'll notice specific patterns:
| Pattern | What It Means | Action |
|---|---|---|
| Sharp Spike | Viewers jumping TO this chapter | This chapter title/topic is valuable |
| Gradual Decline | Normal viewing, no skipping | Content is engaging, keep format |
| Sharp Drop | Viewers leaving or skipping FROM here | Improve content or move chapter earlier |
| Small Dip Then Recovery | Chapter transition (normal) | Expected behavior, no action needed |
| Multiple Small Spikes | Viewers exploring different chapters | Chapters are being actively used |
Comparing Retention With and Without Chapters
Look at the overall shape of your retention curve:
- Without chapters: Usually a smooth downward curve with predictable drop-off points
- With chapters: More variable with spikes/dips but often higher overall baseline retention
Measuring Chapter Engagement
While YouTube doesn't provide direct "chapter click" data, you can infer engagement through several methods:
Method 1: Retention Spike Analysis
Identify all retention spikes in your graph. Each spike represents viewers jumping to that timestamp. Compare spike locations to your chapter timestamps:
- Spike at chapter start: Chapter title attracted viewers
- No spike at chapter start: Chapter title may not be compelling enough
- Spike 10-20 seconds after chapter: Viewers previewing content then engaging
Method 2: Average View Duration Segments
YouTube shows AVD as both a total number and a percentage. Calculate AVD for individual chapters:
Calculating Per-Chapter AVD
Formula: Retention at chapter start - Retention at chapter end = Drop-off rate
Example:
- Chapter starts at 2:00 with 75% retention
- Chapter ends at 4:00 with 60% retention
- Drop-off = 15% (this is normal)
- If drop-off exceeds 30%, investigate content quality
Method 3: Most Replayed Correlation
The "Most Replayed" feature highlights sections viewers rewatch. Cross-reference these with your chapters:
- Most replayed segments within a chapter = high-value content
- Consider making heavily replayed sections into standalone chapters
- Use most replayed data to optimize chapter titles and descriptions
Optimize Your Chapter Strategy
Generate data-backed chapter suggestions for your videos in seconds with our AI-powered tool.
Try Free Timestamp Generator →
Identifying Skip-To Patterns
One of the most valuable insights from chapter analytics is understanding where viewers want to go. This reveals what content your audience truly values.
How to See Which Chapters Get Skipped To
List Your Chapter Timestamps
Map Retention Spikes
Rank by Spike Magnitude
Analyze the Pattern
Common Skip Patterns and What They Mean
| Skip Pattern | Interpretation | Optimization Strategy |
|---|---|---|
| Everyone skips intro | Intro too long or not valuable | Shorten intro, deliver value faster |
| Skip to middle chapter | That chapter solves viewer problem | Consider making it chapter 1 or video thumbnail topic |
| Skip final chapter | CTA or outro not compelling | Improve call-to-action or add bonus content |
| Random skipping throughout | Viewers seeking specific info | Good! Chapters are working as intended |
| No skipping detected | Content is engaging OR chapters aren't visible/useful | Verify chapters display correctly; test more descriptive titles |
Retention spikes can also occur from external links (social media posts, blog embeds) that deep-link to specific timestamps. Consider traffic sources when analyzing spike patterns.

Watch Time & AVD Analysis
Chapters' ultimate value lies in their impact on your two most important metrics: total watch time and average view duration.
Tracking Watch Time Changes
Here's the systematic approach to measuring chapter impact on watch time:
Watch Time Comparison Method
Before Adding Chapters:
- Record: Total watch time (hours)
- Record: Average view duration (time & percentage)
- Record: Total views in that period
- Note the date
After Adding Chapters:
- Wait 2-4 weeks for significant data (1000+ views ideal)
- Use date comparison in YouTube Analytics
- Compare metrics from equivalent time periods
- Calculate percentage change for each metric
What Good Performance Looks Like
Why AVD might not increase: Individual viewing sessions may be shorter (viewers find exactly what they need), but MORE viewers complete satisfying portions, increasing total watch time.
A/B Testing Chapter Strategies
The only way to truly optimize your chapter strategy is through systematic testing. Here's how to A/B test effectively:
What to Test
- Chapter count: 5 chapters vs. 10 chapters for same video
- Chapter titles: Generic ("Introduction") vs. specific ("3 Camera Settings That Changed Everything")
- Chapter placement: Evenly spaced vs. based on topic transitions
- Chapter length: Short 1-2 min chapters vs. longer 3-5 min chapters
A/B Testing Method for Chapters
Establish Baseline
Make ONE Change
Wait for Statistical Significance
Document and Iterate
Sample A/B Test: Chapter Title Specificity
| Chapter Position | Generic Title (Version A) | Specific Title (Version B) | Result |
|---|---|---|---|
| 0:00 | Introduction | Why Most Videos Get 0 Views | Version B: +18% retention |
| 2:15 | Main Content | The 3-Second Hook Formula | Version B: +34% skip-to rate |
| 8:30 | Examples | Real Results: 10K to 100K Subs | Version B: +41% engagement |
| 12:00 | Conclusion | Your 7-Day Action Plan | Version B: +22% completion |
Result: Specific, benefit-driven chapter titles outperformed generic labels across all metrics. Total watch time increased by 27%.
Generate Optimized Chapter Titles
Our AI analyzes your video content to create specific, engaging chapter titles that drive higher engagement.
Create Better Chapters Now →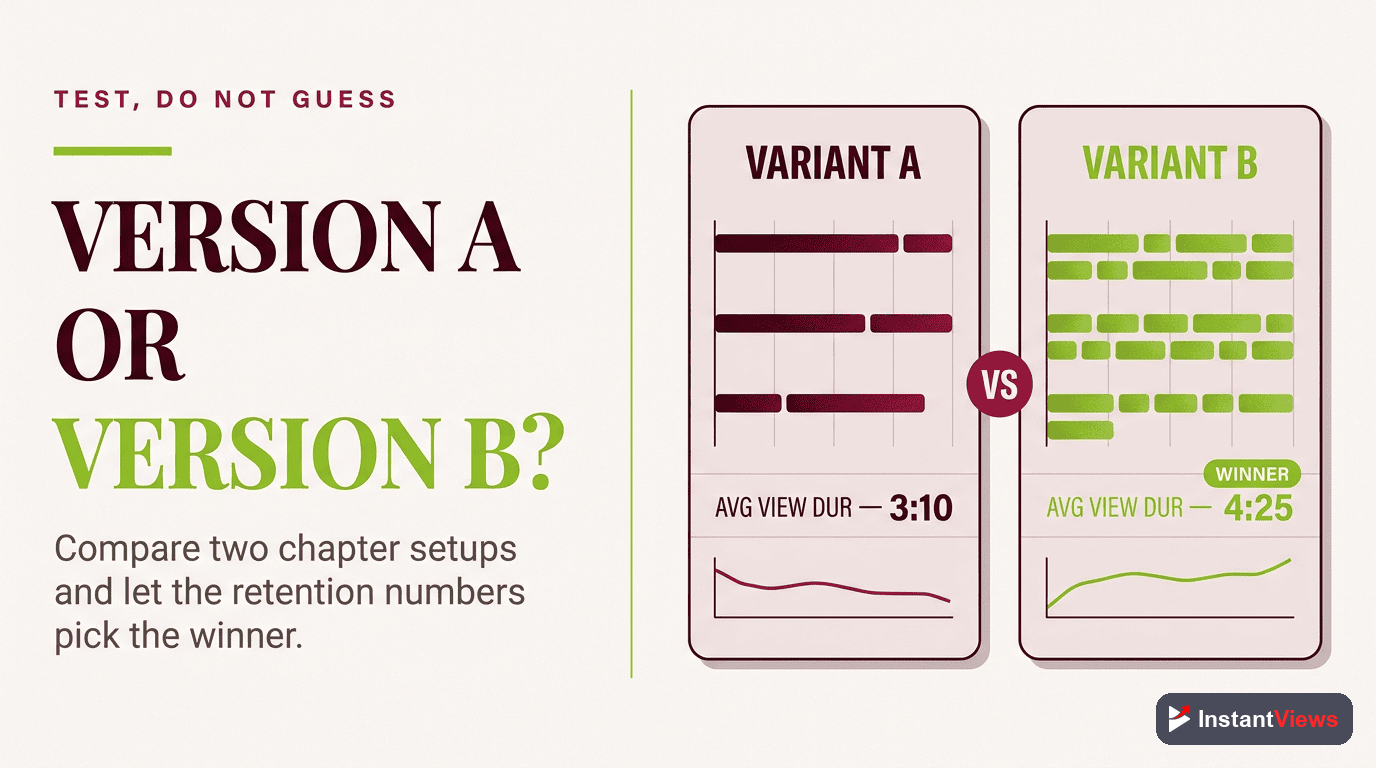
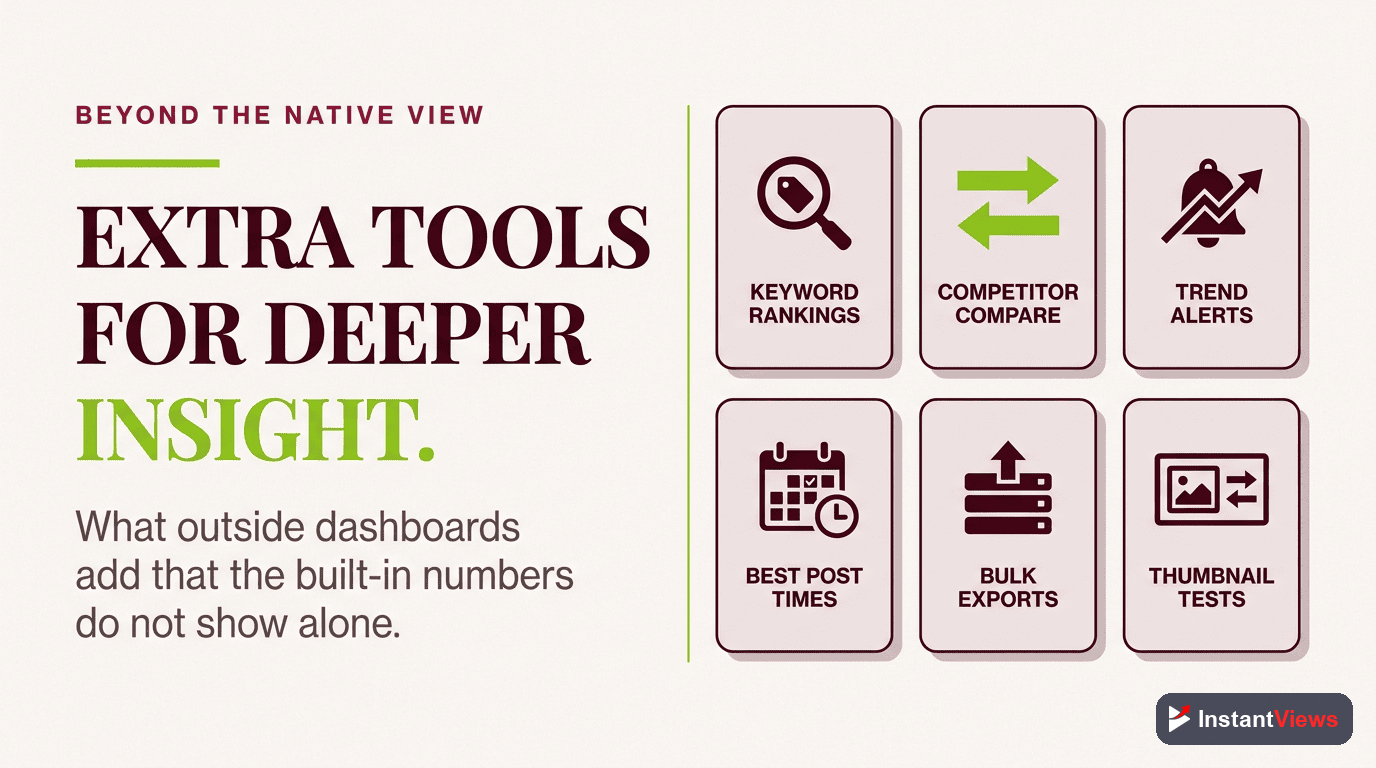
Third-Party Analytics Tools
While YouTube Studio provides solid analytics, third-party tools offer enhanced chapter-specific features:
1. TubeBuddy
TubeBuddy Chapter Features
Chapter-relevant features:
- Retention graph overlay with chapter markers
- Competitor chapter analysis
- A/B testing for chapter structures (higher tiers)
- Bulk chapter editor for multiple videos
- Chapter template library
Best for: Creators optimizing existing chapter strategies and testing variations.
2. VidIQ
VidIQ Analytics Enhancement
Chapter-relevant features:
- Enhanced retention visualization with chapter zones
- Engagement velocity metrics per chapter
- Competitor chapter strategy insights
- Chapter SEO scoring
- Trending chapter patterns in your niche
Best for: Creators focused on competitive analysis and SEO optimization of chapters.
3. Social Blade (Limited Chapter Data)
Social Blade tracks overall performance but doesn't provide chapter-specific analytics. However, you can use it to:
- Track watch time changes correlated with chapter implementation dates
- Compare your retention patterns to channel averages
- Monitor long-term growth impact of chapter optimization
4. YouTube Data API (For Developers)
If you have technical skills, YouTube's Data API allows you to:
- Programmatically retrieve video analytics
- Build custom dashboards tracking chapter performance
- Automate chapter performance reports
- Track chapter data across your entire channel
Using Data for Optimization
Analytics are only valuable if they drive action. Here's how to translate chapter data into concrete improvements:
Optimization Workflow
Identify Your Worst-Performing Chapter
Diagnose the Issue
Implement ONE Fix
Measure Impact
Scale What Works
Common Optimization Actions Based on Data
| Data Signal | What It Means | Optimization Action |
|---|---|---|
| Large spike at chapter 3 | Viewers want that content first | Move chapter 3 to position 1 |
| Steep drop in chapter 2 | Content not matching expectations | Rewrite chapter title to be more accurate or improve content quality |
| No spikes anywhere | Chapters not compelling or visible | Make titles more specific and benefit-driven |
| High engagement in final chapter | Strong CTA/conclusion | Replicate this conclusion style in other videos |
| Watch time up but AVD down | Chapters working perfectly | Maintain current strategy, optimize further |
Creating a Chapter Performance Dashboard
Track these metrics in a spreadsheet for each video with chapters:
- Video title & upload date
- Chapter count
- Total watch time (before & after chapters)
- Average view duration (before & after)
- Most popular chapter (based on spikes)
- Least popular chapter (lowest retention)
- Overall retention change (%)
- Notes on what worked/didn't work
Over time, patterns will emerge that inform your entire content strategy, not just chapter placement.
Advanced Analytics Techniques
Cohort Analysis for Chapters
Group viewers by how they discovered your video, then analyze if chapter engagement differs by traffic source:
- Search traffic: Often skips directly to solution chapters
- Suggested videos: May watch more linearly
- External links: Might deep-link to specific chapters
- Subscribers: Higher completion rates across all chapters
This helps you optimize chapter structures differently for videos targeting different traffic sources.
Long-Term Performance Tracking
Chapter impact compounds over time. Track these long-term metrics:
- Session starts from chapters: Videos with chapters may generate more return visits
- Subscriber conversion: Do chapter-enabled videos convert better?
- Algorithm favorability: Track impressions and CTR trends post-chapter implementation
- Revenue impact: If monetized, does watch time increase translate to revenue?
Frequently Asked Questions
YouTube doesn't provide individual chapter click data in Studio Analytics. However, you can infer chapter performance by analyzing the retention graph spikes at chapter timestamps and using third-party tools like TubeBuddy or VidIQ for more detailed chapter engagement metrics.
Chapter-related viewer behavior appears in YouTube Analytics within 24-48 hours. For meaningful insights, wait at least 2-4 weeks with 1000+ views to ensure you have statistically significant data before making optimization decisions.
A successful chapter typically maintains 60-70% of the viewers who entered that chapter. If retention drops below 40% during a chapter, consider improving that section's content, title clarity, or positioning within your video.
No. Whether viewers watch linearly or skip via chapters, all watch time counts equally in your analytics, monetization, and algorithm ranking. The viewing method doesn't affect how YouTube measures or values the engagement.
Create two similar videos with different chapter structures, or update chapters on an existing video and compare before/after metrics using YouTube Analytics date comparison. Wait 2-4 weeks between tests for valid results. Document baseline metrics before each change.
Create a spreadsheet tracking key metrics per video: total watch time, AVD, retention at chapter boundaries, and engagement rates. Export data from YouTube Analytics monthly. Look for patterns in chapter structures that correlate with higher performance.
Google Analytics can't directly track YouTube chapter interactions. However, if you embed videos on your website, you can use YouTube IFrame API with Google Analytics events to track chapter clicks and engagement on your site.
Indirectly, yes. Chapters that improve watch time, retention, and viewer satisfaction boost your video's performance signals, which increases recommendation rates. Track "Traffic source: Suggested videos" in Analytics to see this impact over time.
Final Thoughts
YouTube chapter analytics transform chapters from a nice-to-have feature into a strategic optimization lever. By systematically tracking retention patterns, skip-to behavior, and watch time changes, you can make data-driven decisions that compound over time.
The creators who succeed with chapters aren't the ones who add them once and forget—they're the ones who continuously analyze, test, and refine based on real viewer behavior data.
Start with these key actions:
- Screenshot your current retention graphs to establish baselines
- Add chapters to 3-5 existing videos using the patterns in this guide
- Wait 2-4 weeks for meaningful data to accumulate
- Compare before/after metrics using YouTube Analytics
- Document what works and scale it across your content
Remember: the goal isn't perfect chapters on day one. It's building a systematic, analytics-driven process that improves with every video you publish.
The data doesn't lie. Let viewer behavior guide your chapter strategy, and you'll build videos that serve your audience better while growing your channel faster.
Related guides:
- How YouTube Chapters Affect Watch Time
- YouTube Chapters SEO Benefits
- Best YouTube Chapter Length Guide