- Views and subscribers are outcomes; the hidden metrics are the levers that produce them
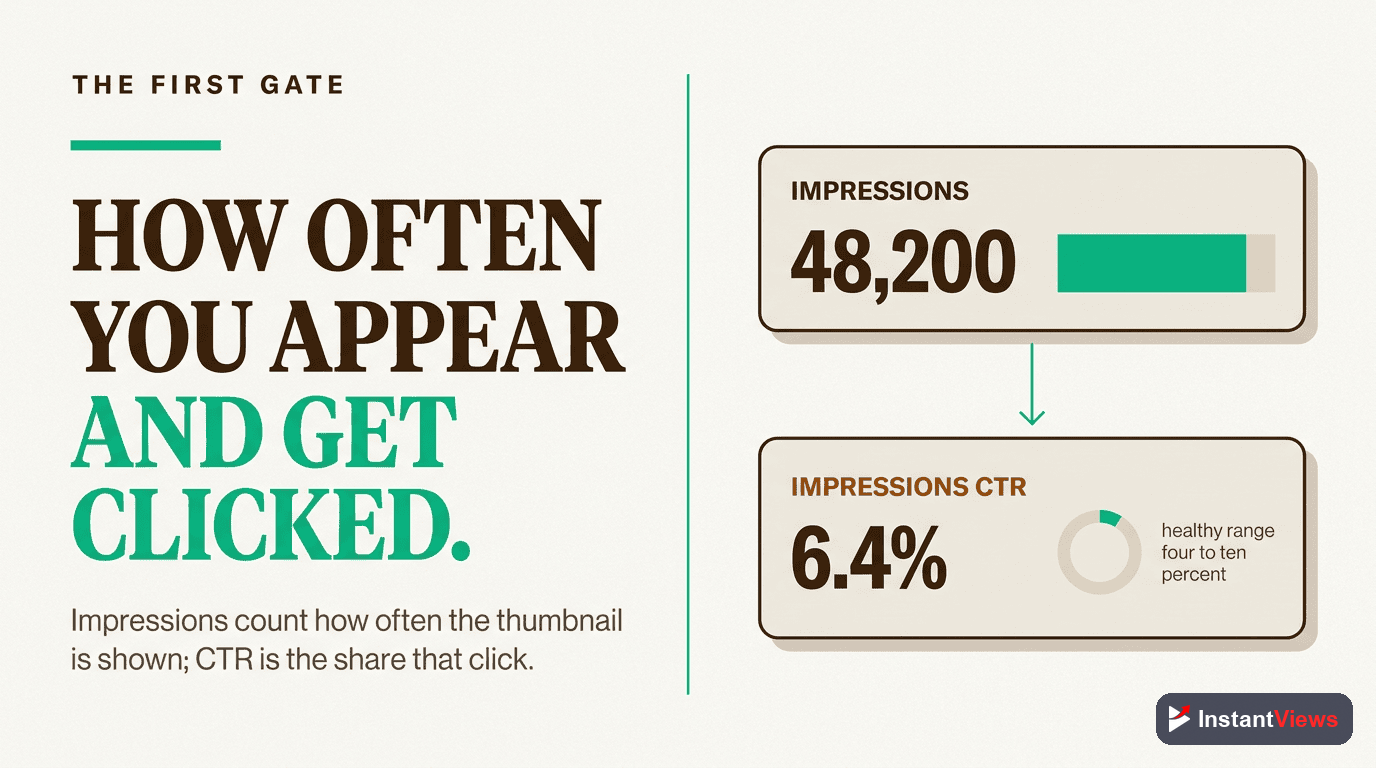
- Impressions click-through rate tells you whether your packaging earns the click, before content ever matters
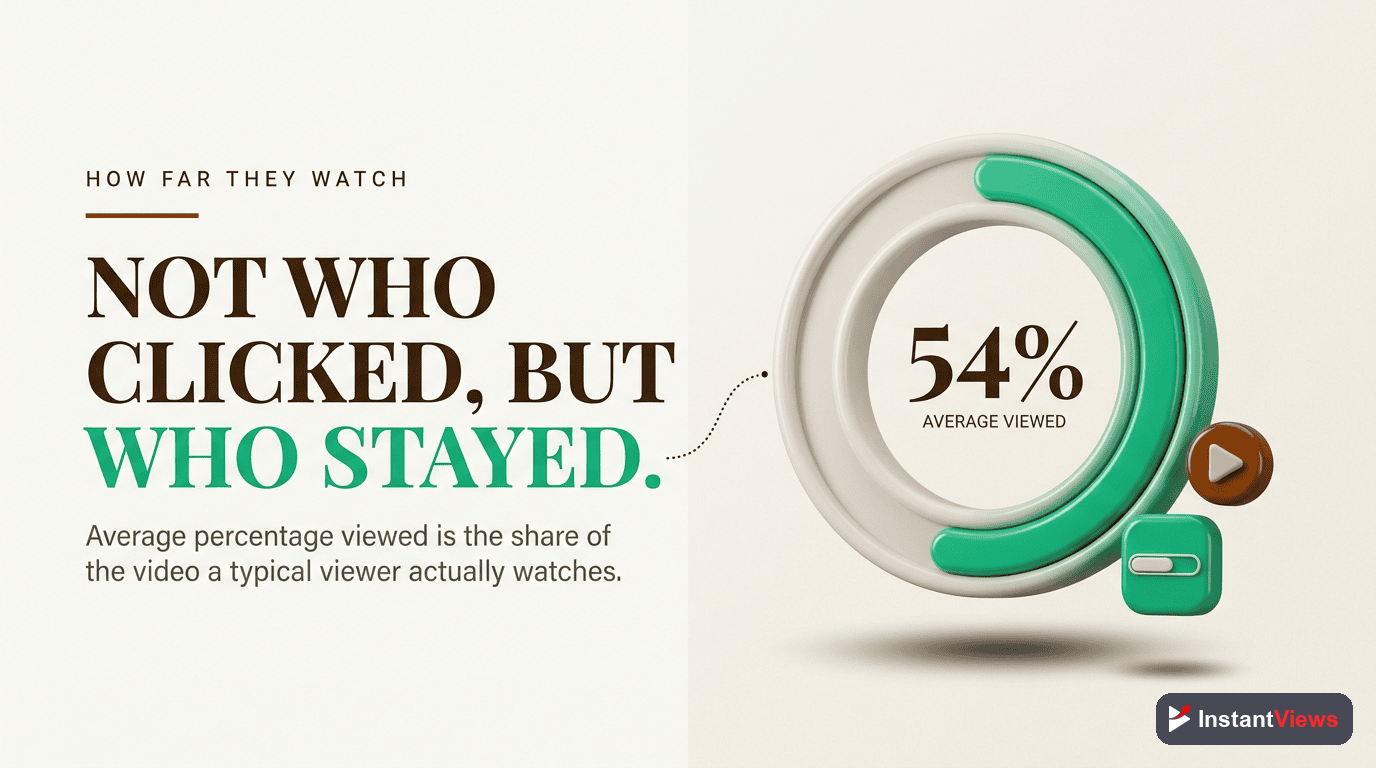
- Average percentage viewed and relative retention reveal whether your video keeps the promise the thumbnail made
- Returning viewers, unique viewers, and traffic sources show who is really watching and where they came from
- The 2026 algorithm rewards genuine viewer satisfaction, so the shape of your retention curve matters more than raw watch time
Open almost any creator's channel page and you will see two numbers: total views and total subscribers. They are the metrics everyone shows off, and they are also the least useful for actually growing a channel. They tell you what happened, but never why. With more than 2.7 billion monthly active users and over a billion hours of video watched every day, YouTube generates an enormous amount of data about every video you publish — and the creators who grow on purpose live in the part of that data most people never open.
Beneath the headline stats sits a layer of advanced metrics that explains exactly why a video took off or stalled: how often your thumbnail was shown, how many people clicked it, how long they stayed, whether they were new faces or loyal regulars, and where they came from in the first place. None of these appear on your public channel page. All of them are a couple of clicks away inside YouTube Studio.
This guide is about those hidden metrics — the numbers beyond views and subscribers. We will define each one in plain language, explain precisely what it reveals about your channel, and give you a clear action to take when it looks wrong. We will also look at how the 2026 algorithm, which optimizes for viewer satisfaction and retention rather than raw watch time, has changed which of these numbers deserve your attention.
This is not a beginner tour of which metrics matter, nor a walkthrough of how to navigate the dashboard. It is the next level: the less-obvious signals that top creators check on every upload, and how to turn each one into a decision.
- Why the Headline Stats Mislead You
- Impressions and Impressions CTR
- Average Percentage Viewed
- Relative Retention: The Fairest Score
- Reading the Retention Curve Shape
- Unique, Returning, and New Viewers
- Traffic Source Breakdown
- End-Screen and Card Click-Through Rate
- The Hidden Metrics Cheat Sheet
- A Five-Step Diagnostic Workflow
- FAQ
Why the Headline Stats Mislead You
Views and subscribers are lagging indicators. By the time they move, the decisions that caused them have already happened — the thumbnail was already designed, the intro was already filmed, the topic was already chosen. You can stare at your view count all day and it will never tell you which of those decisions to change next time.
The hidden metrics are leading indicators. They sit upstream of views and explain how each view was earned or lost. A video with a strong click-through rate but weak retention has a content problem. A video with great retention but few impressions has a discovery problem. A video full of new viewers but no returning ones has a loyalty problem. The headline number — views — would look identical in all three cases, yet the fix for each is completely different.
This is also why comparing your raw view count to a bigger creator's is a trap. Their numbers are the product of years of compounding loyalty and a back catalogue that feeds suggestions. The advanced metrics let you benchmark against the only fair competitor that exists: your own previous videos. Did this upload hold attention better than your last one? Did it earn more clicks per impression? Those questions are answerable, and the answers point directly at your next action.

Impressions and Impressions CTR
An impression is counted each time YouTube shows your thumbnail to a real person on the home feed, in suggested videos, or on the subscriptions tab. It is the platform raising its hand and saying, "I am willing to recommend this." Impressions are the supply of opportunities the algorithm is giving you.
Impressions click-through rate (CTR) is the percentage of those impressions that turned into a click. It is the single clearest measure of whether your packaging — your thumbnail and title together — is doing its job. Across niches in 2026, most channels land somewhere between roughly 2% and 10%, with many healthy videos sitting in the 4–6% range; rates vary widely by niche and by where the impression appeared.
What it reveals
CTR isolates the click decision from everything that happens after it. A viewer judges your thumbnail and title in a fraction of a second, with zero knowledge of how good the video actually is. So a low CTR almost always means a packaging problem, not a content problem.
How to act on it
- Low CTR, high impressions: YouTube is offering you reach, but your packaging is not converting it. Redesign the thumbnail for clarity and contrast, and sharpen the title's promise.
- High CTR, low impressions: Your packaging works, but the algorithm is being cautious. This is usually a retention or freshness issue — the video needs to prove it satisfies the viewers who do click.
- Falling impressions over time: A declining impression count signals the algorithm is reducing distribution, often because click-through or watch time slipped. Treat it as an early warning, not a verdict.
Do not chase CTR with misleading thumbnails. A clickbait thumbnail can spike your click-through rate and then crater your retention when the video fails to deliver. The 2026 algorithm pairs CTR with satisfaction signals, so a high click rate followed by fast abandonment hurts you more than a modest CTR with strong retention.
Average Percentage Viewed
Average view duration tells you how many minutes people watched. Average percentage viewed tells you what share of the whole video they watched, and it is the more honest of the two because it is not skewed by length. Forty percent of a four-minute video and forty percent of a forty-minute video describe the same level of holding power, even though the minute counts are wildly different.
As a rough 2026 guideline, long-form videos are generally healthy in the 40–60% range, while Shorts often run 70% or higher because of their length and looping format. Tutorial and how-to content tends to be healthy around 45–55%. The platform-wide average sits much lower, which means there is enormous room to stand out simply by holding attention better than the typical video.
What it reveals
Average percentage viewed is the clearest read on whether your content keeps the promise your thumbnail made. A strong CTR followed by a weak percentage viewed is the classic signature of over-promising: people clicked, then realized the video was not what they expected, and left.
Relative Retention: The Fairest Score
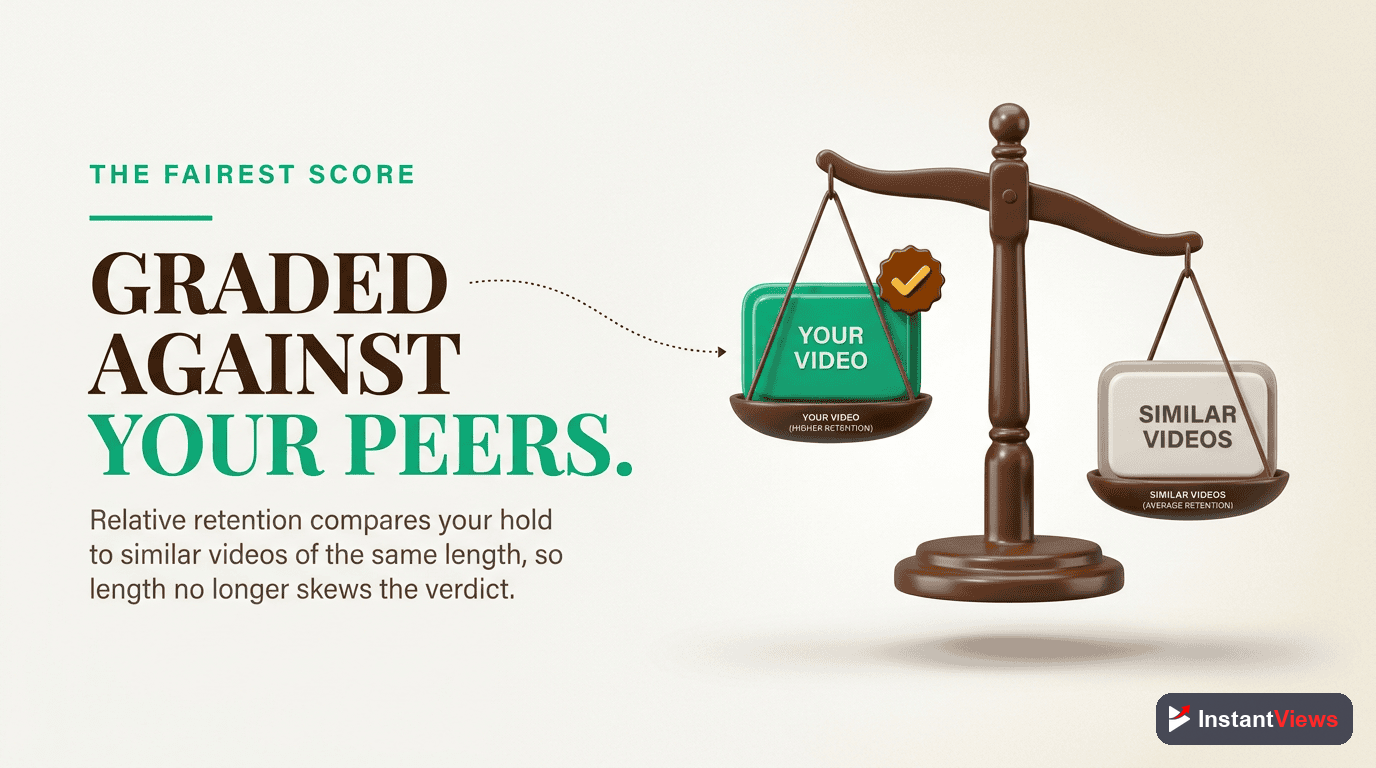
There is a built-in unfairness in raw retention numbers: longer videos almost always show lower percentages, simply because there is more video to drop out of. Relative retention fixes this. It compares your video to other YouTube videos of a similar length, then scores the result on a scale from 0 to 1. A value near 1 means you hold viewers better than most comparable videos; a value near 0 means worse.
This is the metric that lets you answer the question that actually matters: not "did people watch a high percentage of my video?" but "did my video out-hold the competition for its length?" A 20-minute video with 38% average percentage viewed might sound mediocre in isolation, yet have excellent relative retention because 20-minute videos rarely hold people that long.
How to act on it
- High relative retention: Your format is working for its length. Make more in this style, and consider this a topic and structure worth repeating.
- Low relative retention: Even allowing for length, similar videos hold viewers better than yours. Tighten the pacing, cut dead sections, and front-load the payoff.
- Use it to defend long-form: Before you shorten everything in a panic over raw percentages, check relative retention. Your long videos may be performing better than the headline number suggests.
Reading the Retention Curve Shape
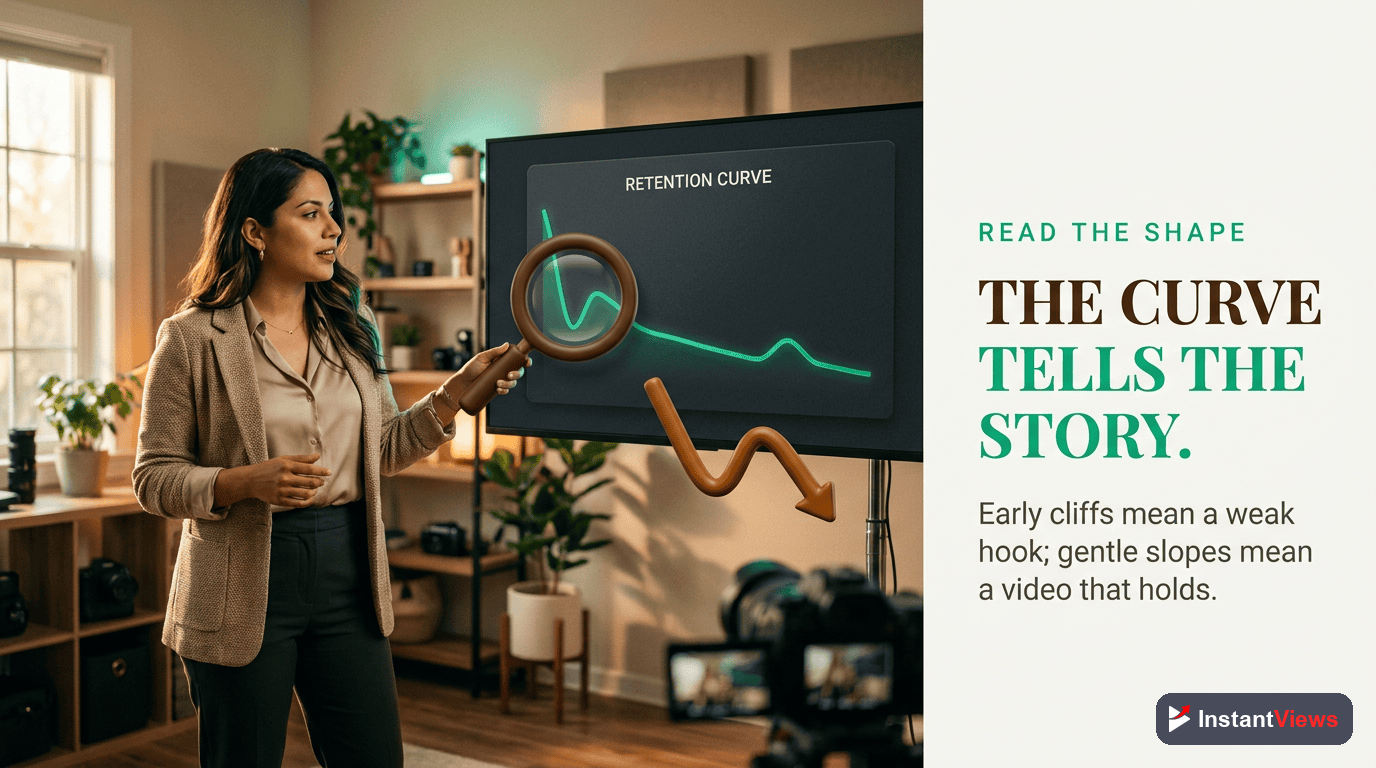
A single retention number is useful, but the retention curve is where the real diagnosis lives. The curve plots the percentage of viewers still watching at every moment of the video, and its shape tells a story that no average ever could. Successful creators read the curve like a doctor reads an EKG, and there are four shapes worth recognizing.
The four curve types
- The cliff: A steep drop in the first 15–30 seconds. Some early loss is normal as the wrong-fit viewers leave, but a severe cliff means your intro is not delivering on the thumbnail fast enough.
- The steady decline: A smooth, gentle slope with no sharp drops. This is the healthiest common shape — people are leaving at a natural rate, not fleeing a specific moment.
- The dip: A sudden drop in the middle of the video. Scrub to that exact timestamp; you will usually find a slow tangent, a long sponsor read, or a section that lost the thread.
- The spike: A bump upward, meaning viewers rewound or re-watched a moment. This marks something genuinely valuable — a key tip, a surprising reveal, a clip worth clipping — and it is a signal of what to do more of.
Under the 2026 algorithm's "good abandonment" framing, not every exit is a failure. A viewer who leaves the moment they get the answer they came for is satisfied, not lost, and the platform no longer treats that the way it treats an early, frustrated bounce. This makes the shape and placement of drop-offs far more informative than the single percentage at the end.
"Stop asking how many people watched. Start asking exactly where they left, and why. The timestamp of a drop-off is worth more than the size of your view count — because the timestamp tells you what to fix."
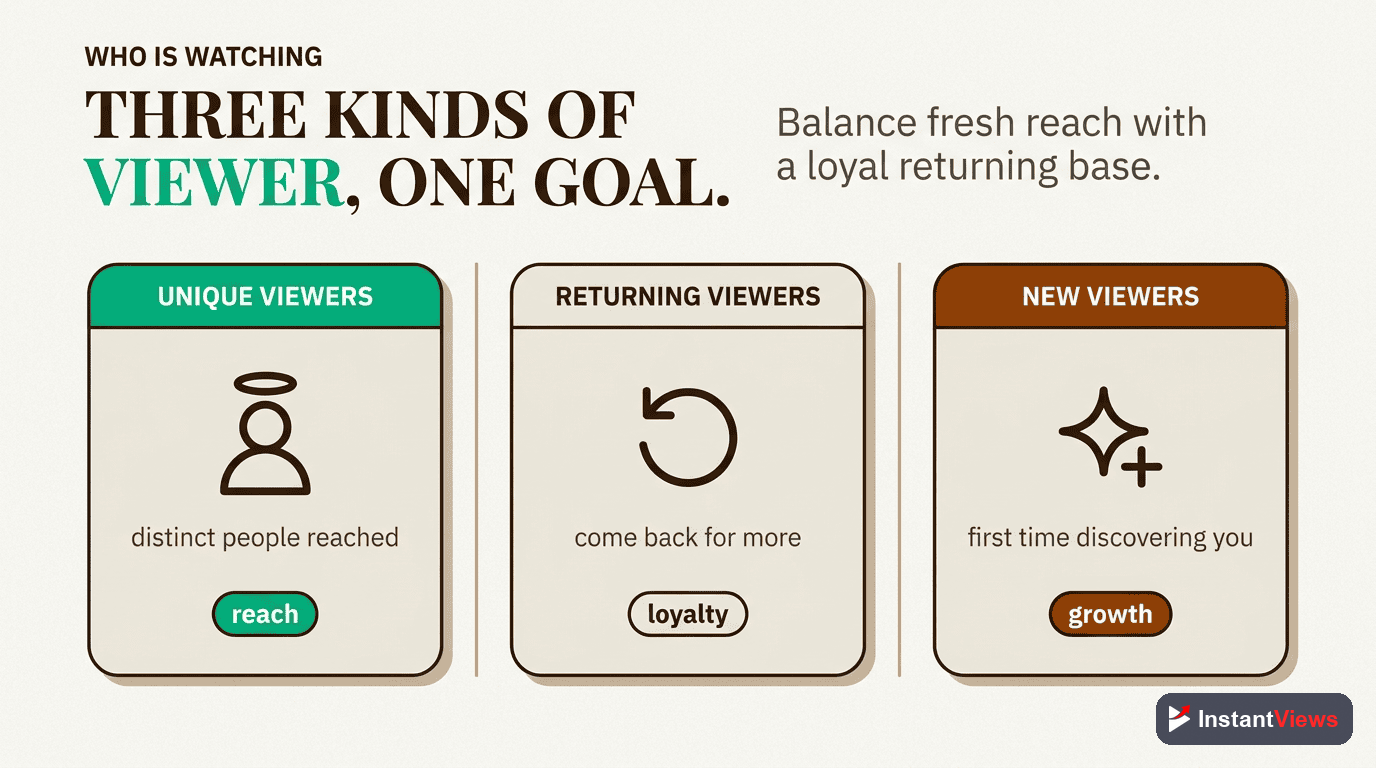
Unique, Returning, and New Viewers
Your view count double-counts people. One devoted fan who watches a video three times adds three views but is a single human. Unique viewers — the estimated number of distinct individuals who watched in a period — cuts through that and tells you the true size of your audience. It is the difference between popularity and reach.
More revealing still is the split between new and returning viewers. New viewers are discovery; returning viewers are loyalty. A channel that only ever attracts new faces is running on a treadmill, rebuilding its audience with every upload. A channel with a steadily rising returning-viewer count is compounding — each video inherits an audience that already trusts it.
What it reveals and how to act
- Mostly new viewers, few returning: Your content gets discovered but does not create the habit of coming back. Strengthen your channel identity, give people a reason to subscribe, and connect videos with playlists and end screens.
- Mostly returning, few new: You have loyalty but limited discovery. Lean into searchable and shareable topics and Shorts to widen the top of the funnel.
- Returning viewers climbing month over month: The single best long-term health signal a channel has. Steady, compounding growth almost always follows a rising returning-viewer base.
Traffic Source Breakdown
The traffic source report shows how viewers actually found each video — YouTube search, suggested videos, the home feed (browse features), external sites, Shorts feed, channel pages, playlists, or notifications. This is one of the most actionable hidden metrics because each source rewards a different strategy, and knowing the mix tells you what kind of video you really made.
| Traffic Source | What It Means | How to Act |
|---|---|---|
| YouTube Search | People are actively looking for this topic; evergreen, durable views. | Double down on searchable titles and questions; this traffic keeps paying for years. |
| Suggested Videos | The algorithm is recommending you beside related content — the main growth engine. | Study which videos you appear next to and make content that bridges to them. |
| Browse Features (Home) | YouTube is pushing you to its home feed; strong reach but more volatile. | Packaging and early retention decide whether this snowballs or fades. |
| External | Traffic from outside YouTube — social posts, blogs, newsletters, embeds. | Useful for launches, but on-platform sources signal healthier organic reach. |
| Shorts Feed | Discovery from the Shorts surface, which drives 200B+ views a day. | Use Shorts to feed awareness, then guide viewers to long-form. |
The goal over time is a shift away from depending on external traffic and toward search and suggested, the two on-platform sources that signal the algorithm has decided to distribute you on its own. When a video is carried mostly by suggested videos, you have found something the algorithm wants to keep recommending — the closest thing to a growth flywheel on the platform.

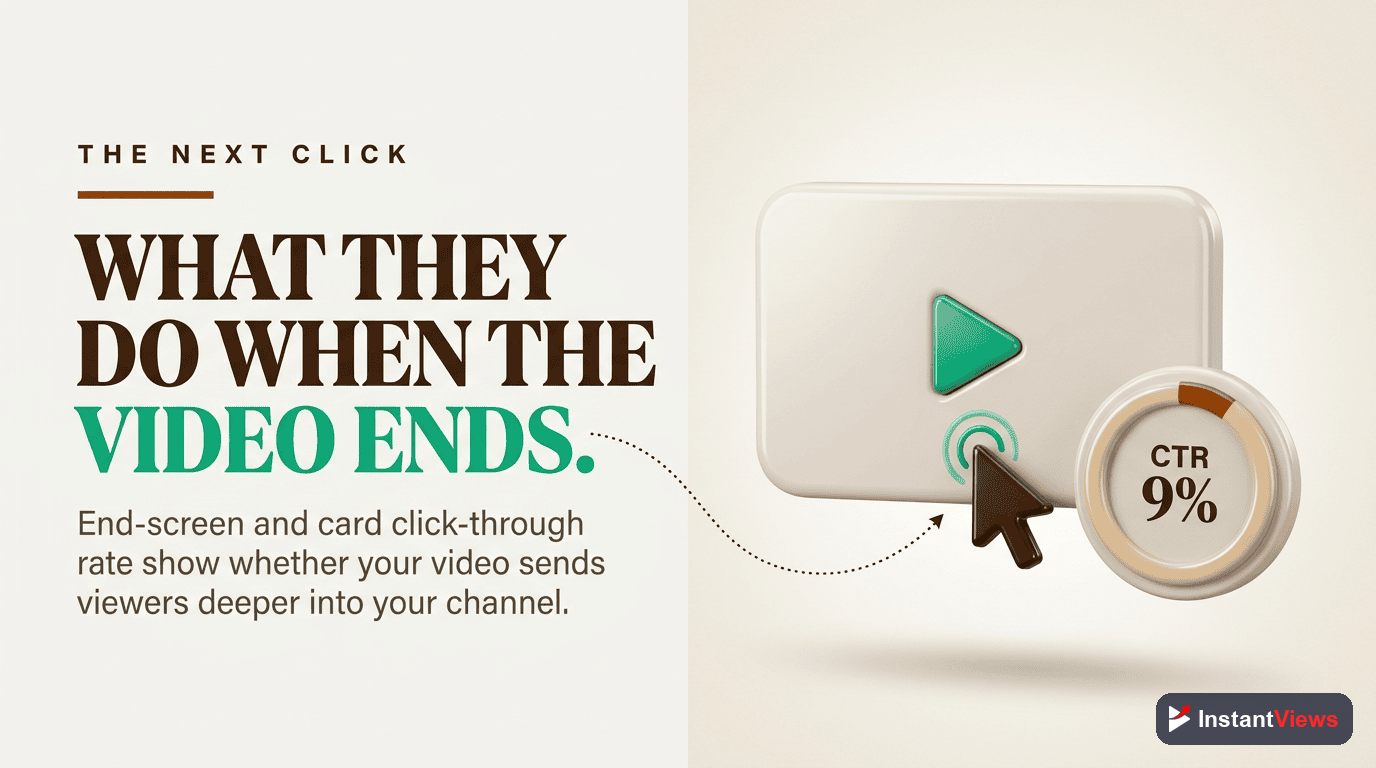
End-Screen and Card Click-Through Rate
The last hidden metric most creators ignore is what happens at the end of the journey. End-screen click-through rate measures how often viewers click the elements you place in the final seconds of a video, and card CTR does the same for the small prompts that appear mid-video. These are the mechanics that turn one view into a session of several — and session length is something the 2026 algorithm cares about deeply.
What it reveals
A weak end-screen CTR usually means one of two things: viewers are not reaching the end (a retention problem), or the next video you are offering is not compelling enough (a packaging or relevance problem). Because keeping a viewer on YouTube watching your next video sends a powerful satisfaction signal, this metric punches above its weight.
How to act on it
- Offer a tightly relevant next video on the end screen — the natural sequel to what they just watched, not a random old upload.
- Verbally tee up the click in your outro. "If you want the advanced version, watch this next" outperforms a silent end screen every time.
- Place cards at curiosity peaks, not random timestamps — right after you reference something a card can expand on.
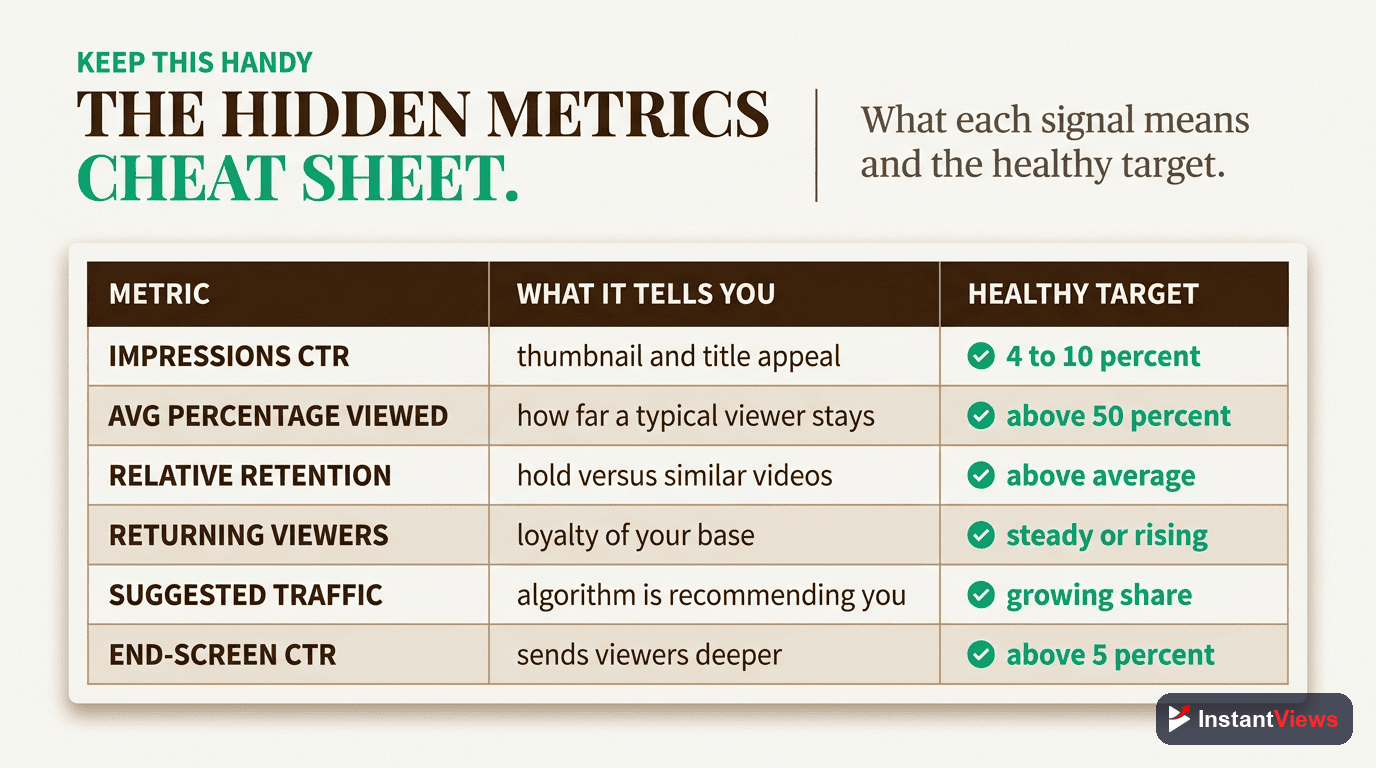
The Hidden Metrics Cheat Sheet
Here is the whole framework in one view: each hidden metric, what it reveals about your channel, and the action to take when it is your weakest link.
| Hidden Metric | What It Reveals | Action |
|---|---|---|
| Impressions | How many opportunities the algorithm is giving you. | Falling? Improve CTR and retention to win back distribution. |
| Impressions CTR | Whether your thumbnail and title earn the click. | Low? Redesign packaging for clarity, contrast, and a sharper promise. |
| Average % Viewed | Whether the video keeps the thumbnail's promise. | Low? Tighten the intro and cut dead sections. |
| Relative Retention | How you hold viewers versus similar-length videos. | Low? Improve pacing; high? Repeat the format and length. |
| Retention Curve Shape | The exact moments viewers leave or re-watch. | Fix the dip; make more of whatever caused the spike. |
| Unique Viewers | The true size of your real audience. | Compare to views to gauge depth versus reach. |
| Returning vs New | Loyalty versus one-time discovery. | Returning low? Build identity, playlists, and a subscribe reason. |
| Traffic Sources | Where your viewers actually came from. | Shift toward search and suggested for durable organic reach. |
| End-Screen CTR | Whether one view becomes a longer session. | Offer a tightly relevant next video and tee it up verbally. |
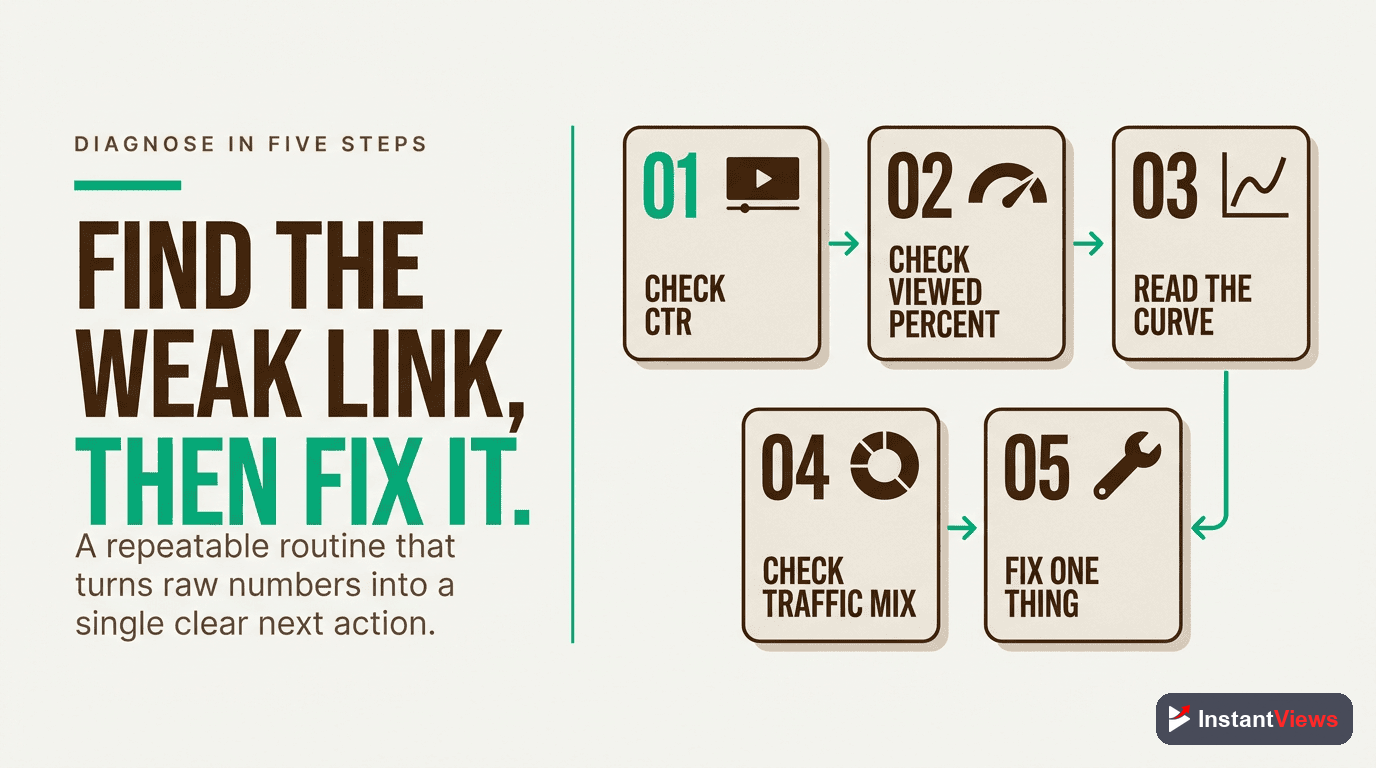
A Five-Step Diagnostic Workflow
Metrics only matter if they change what you do. Here is the exact routine successful creators run on a fresh upload — a repeatable loop you can finish in under fifteen minutes.
Open Advanced Mode
In YouTube Studio, go to Analytics and click Advanced Mode in the top right. This unlocks impressions, impressions CTR, unique viewers, average percentage viewed, and the segments you will need below.
Check the Click Decision
Look at impressions and impressions CTR first. If CTR is below your channel's norm, the packaging is the problem and nothing downstream matters until you fix it.
Read the Retention Curve
Open the video's retention curve. Note the intro drop-off, find any mid-video dip, mark any re-watch spike, and check relative retention to judge it fairly against similar-length videos.
Segment the Audience
Split the data by new versus returning viewers and by traffic source. This tells you who showed up and how they found you, which shapes what you make next.
Change One Thing, Then Re-Measure
Pick the single weakest metric, make one focused change on your next upload, and compare. Changing one variable at a time is the only way to learn what actually moved the result.
A worked example
Imagine a tutorial that got far fewer views than you hoped. The headline stat — views — just says "disappointing." The hidden metrics tell the real story. You open Advanced Mode and find healthy impressions but a below-average CTR, so the algorithm was offering reach you failed to convert. You check retention and find a strong, steady curve with good relative retention — the people who did click loved it. The diagnosis is now obvious: this is a packaging problem, not a content problem. The fix is a clearer thumbnail and a sharper title, not a re-shoot. Without the hidden metrics, you might have wrongly concluded the topic was wrong and abandoned a format your audience actually enjoyed.
That is the entire point of looking beneath views and subscribers. The headline numbers can only tell you that something went well or badly. The hidden metrics tell you which lever to pull next — and pulling the right lever, one upload at a time, is how channels compound.
Frequently Asked Questions
Hidden metrics are the advanced numbers in YouTube Analytics that sit beneath the obvious headline stats of views and subscribers. They include impressions and impressions click-through rate, unique viewers, returning versus new viewers, average percentage viewed, relative retention, traffic source breakdown, and end-screen and card click-through rate. They explain why your views are what they are.
An impression counts each time YouTube shows your thumbnail to someone on the platform, while a view counts when someone actually watches. The gap between them is your impressions click-through rate. If you have many impressions but few views, your thumbnail and title are not earning the click rather than the algorithm holding your video back.
For long-form videos, a healthy average percentage viewed generally lands in the 40 to 60 percent range, while Shorts often run higher at 70 percent or more. Tutorial and how-to content tends to be healthy around 45 to 55 percent. These are guidelines, not hard targets — what matters most is improving your own video against your own past performance.
Relative retention compares your video to other YouTube videos of a similar length, which removes the natural disadvantage longer videos have in raw retention numbers. It is scored between 0 and 1, where a higher value means you hold viewers better than comparable videos. It is the fairest way to judge retention because it grades on a level playing field.
Returning viewers are the foundation of durable channel growth because they come back on purpose, watch longer, and signal lasting loyalty rather than one-time curiosity. A channel that grows only new viewers without building a returning base tends to plateau, while a rising returning-viewer count usually precedes steady, compounding growth.
Open YouTube Studio, go to Analytics, and click Advanced Mode in the top right. There you can add metrics like impressions, impressions click-through rate, unique viewers, and average percentage viewed, and segment them by traffic source, subscription status, new versus returning, geography, and device. The audience retention report and the individual video pages hold the rest.
Yes. The 2026 algorithm optimizes for viewer satisfaction and retention, so the quality of your watch time matters more than the raw quantity. It also recognizes good abandonment, meaning a viewer who leaves after getting their answer is not penalized the way an early, dissatisfied exit is. This makes retention shape and satisfaction signals more important than ever.
Absolutely. Small channels benefit the most because these metrics tell you exactly where to improve before you have enough views to read trends at a glance. Impressions CTR shows whether your packaging works, retention shows whether your content delivers, and traffic sources show where your next viewer is most likely to come from.
Conclusion
Views and subscribers tell you what happened. The hidden metrics tell you why — and why is the only thing you can actually act on. Impressions and click-through rate explain whether your packaging earns the click. Average percentage viewed and relative retention explain whether your content keeps the promise that the click made. Returning viewers, unique viewers, and traffic sources explain who is showing up and where your next viewer will come from. Together they turn a vague feeling that a video "did okay" into a precise diagnosis you can fix.
You do not need to track all of them at once. Start with the two that move the most: impressions click-through rate and the audience-retention curve. One tells you if people click, the other tells you if they stay. When you can read those two fluently, layer in returning viewers and traffic sources to understand loyalty and discovery. With the 2026 algorithm rewarding genuine viewer satisfaction over raw watch time, these are exactly the signals that decide how far each video travels.
Open Advanced Mode on your last three uploads tonight. Find the one metric that is quietly holding each video back, make a single focused change, and watch the next video prove it. That habit — diagnose, change one thing, re-measure — is the quiet routine behind almost every channel that grows on purpose rather than by luck.