- Early retention rate (first 30 seconds) is the strongest individual predictor of video success
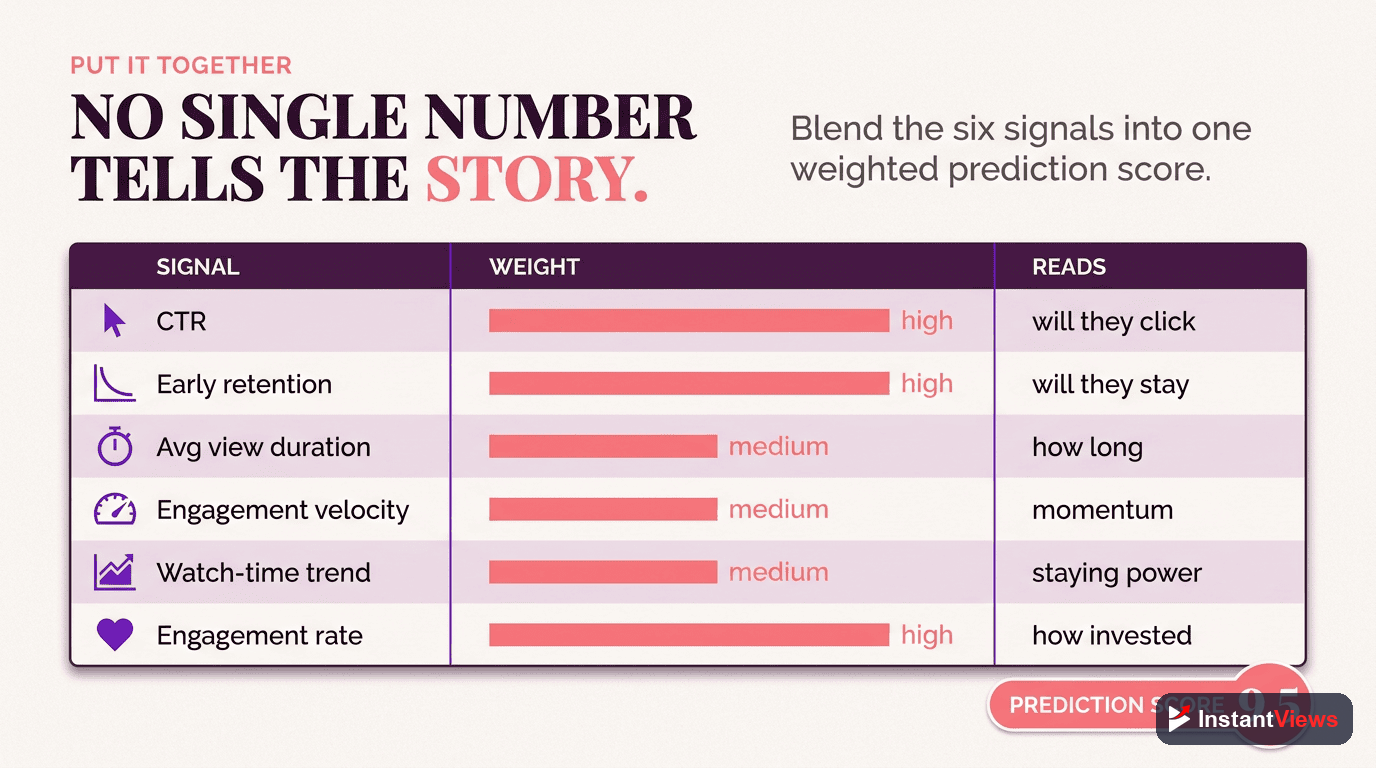
- Combining multiple metrics (CTR, AVD, engagement velocity) increases prediction accuracy to 70-85%
- The first 48 hours provide the most reliable performance forecasts
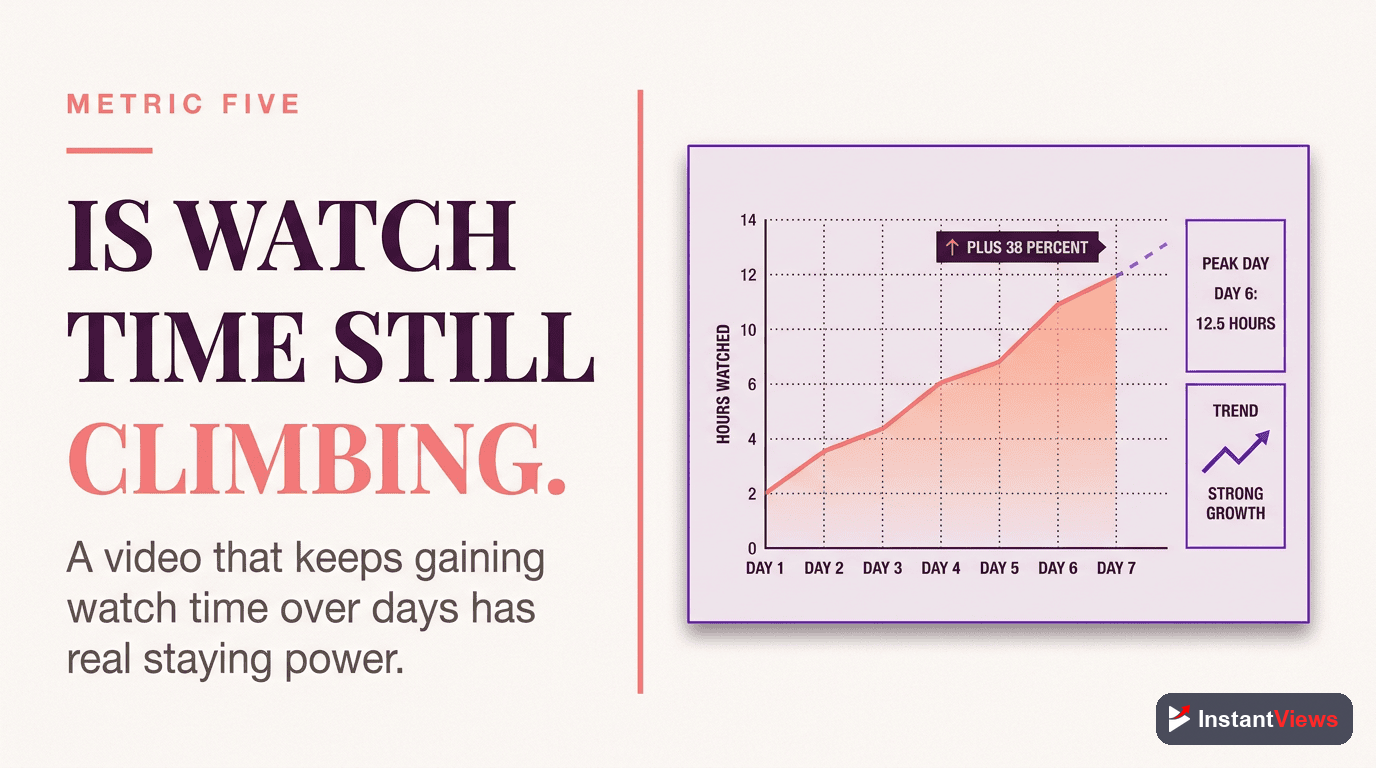
- Watch time velocity and engagement rate reveal audience response quality
- Use prediction data to optimize future content, not just current videos
Imagine knowing whether your video will succeed or fail before the algorithm decides. That's the power of engagement prediction metrics.
YouTube's algorithm makes initial decisions about your video within the first 24-48 hours. During this critical window, specific metrics signal whether your content deserves promotion. Understanding these signals lets you forecast performance and optimize your strategy.
This guide reveals the key metrics that predict video success, how to interpret them, and how to use predictions to create better content.
Why Prediction Metrics Matter
YouTube doesn't wait weeks to judge your video. The algorithm makes critical decisions within hours, using early performance signals to determine how much promotion your content deserves.
Here's what happens in the first 48 hours:
- Hour 1: YouTube shows your video to your core audience and judges initial response
- Hours 2-6: Based on engagement, the algorithm expands or restricts reach
- Hours 12-24: Performance patterns emerge that predict long-term success
- Hours 24-48: The algorithm makes major promotional decisions
Videos that show strong early signals can see exponential growth. Those with weak signals often plateau within days, regardless of content quality.
Don't panic if metrics look weak in the first hour. Wait at least 24 hours before making judgments. Early subscribers often have different viewing patterns than broader audiences.

Metric #1: Click-Through Rate (CTR)
Click-Through Rate (CTR)
CTR measures how often people click your video when they see it. It's the first gate - without clicks, nothing else matters. CTR predicts how well your thumbnail and title resonate with your target audience.
Average CTR: 4-6% | Good: 7-10% | Excellent: 10%+
What it predicts: CTR forecasts your video's ability to compete for views. High CTR signals that your packaging (thumbnail + title) is effective, leading to more impressions.
How to read it:
- Below 4%: Your thumbnail/title needs improvement. The algorithm will limit impressions.
- 4-7%: Average performance. You'll get standard promotion but won't stand out.
- 7-10%: Strong performance. The algorithm will increase impressions significantly.
- Above 10%: Exceptional. Your video has viral potential if retention holds.

Metric #2: Early Retention Rate
Early Retention Rate
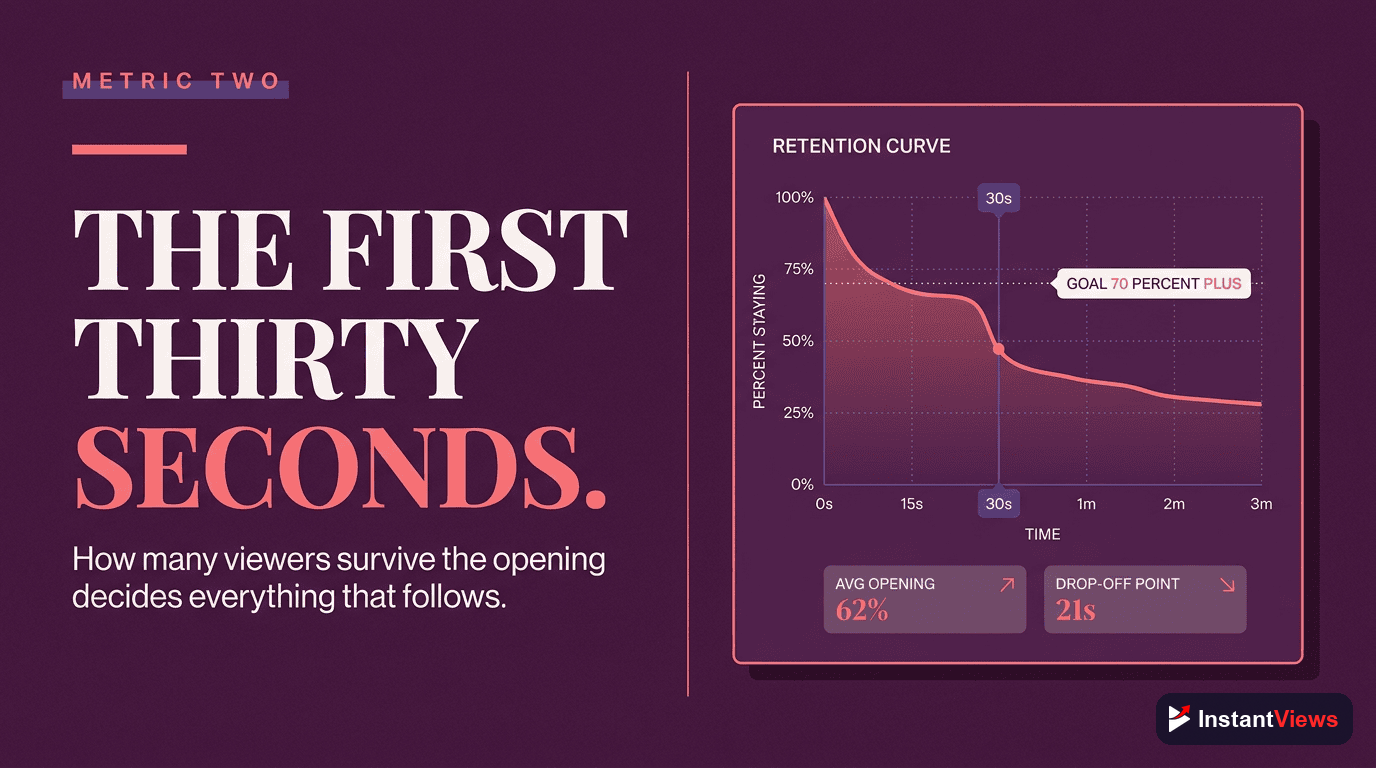
The percentage of viewers still watching at 30 seconds. This is the single strongest predictor of success because it measures hook effectiveness and content-promise alignment.
Average: 60-70% | Good: 70-80% | Excellent: 80%+
What it predicts: Early retention is YouTube's #1 quality signal. Videos with 75%+ retention at 30 seconds typically outperform by 3-5x. It predicts watch time, recommendations, and long-term view velocity.
How to read it:
- Below 60%: Your hook is failing. Viewers feel misled or bored. Fix this in future videos.
- 60-70%: Acceptable but not competitive. You'll get views but limited algorithmic boost.
- 70-80%: Strong hook and content match. Algorithm will promote actively.
- Above 80%: Exceptional engagement. Expect viral trajectory if other metrics align.
Why it's powerful: Early retention measures whether you deliver on your thumbnail/title promise. High CTR gets people to click; high retention keeps them watching. Both together create momentum.
Metric #3: Average View Duration (AVD)
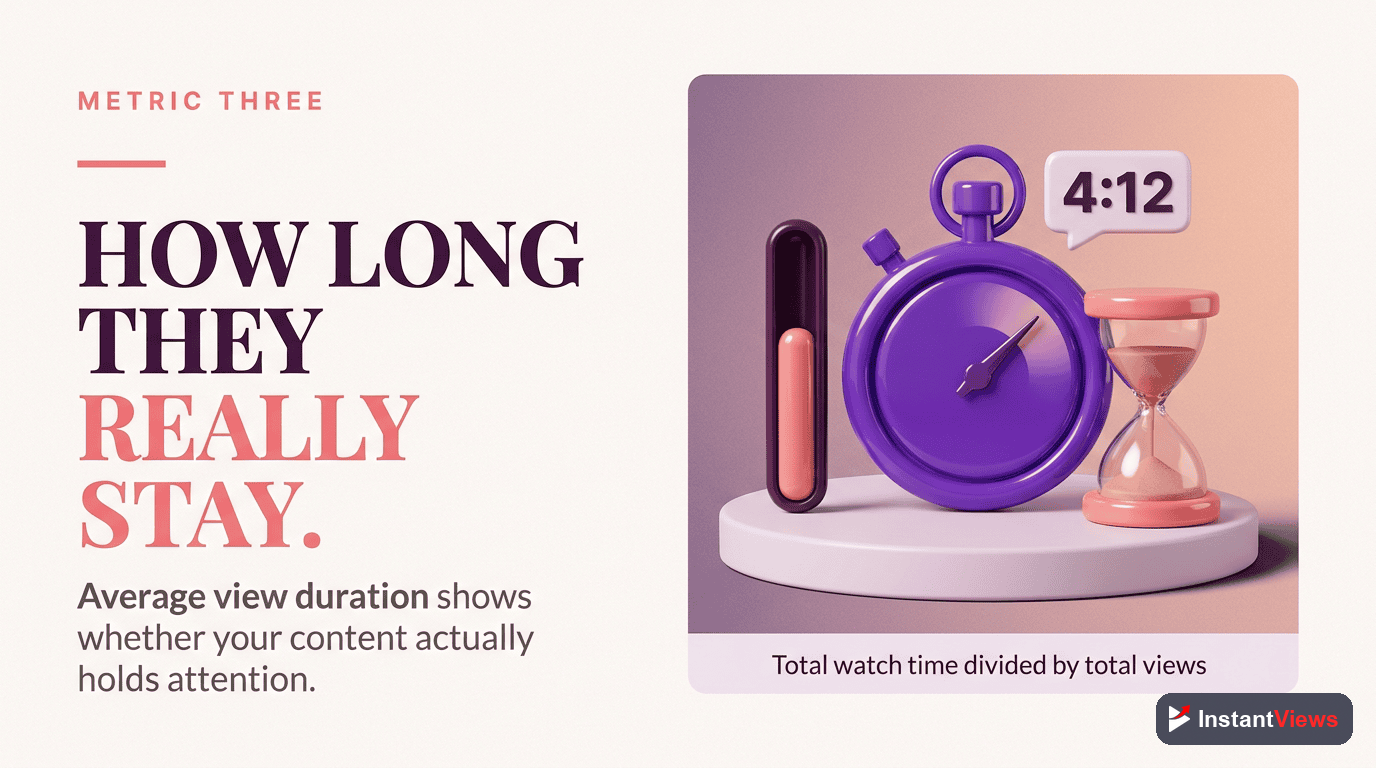
Average View Duration (AVD)
The average time viewers spend watching your video. AVD predicts overall satisfaction and watch time generation - YouTube's most important ranking factor.
Average: 4-5 min (40-50%) | Good: 5-6 min (50-60%) | Excellent: 6+ min (60%+)
What it predicts: AVD forecasts watch time generation. YouTube prioritizes videos that keep viewers on the platform longer. Higher AVD means more recommendations and suggested placements.
How to read it:
- Below 40%: Content isn't holding attention. Pacing, value delivery, or storytelling needs work.
- 40-50%: Average retention. Standard algorithmic treatment.
- 50-60%: Good retention. Algorithm rewards with increased promotion.
- Above 60%: Exceptional. Your content is significantly outperforming expectations.
"We don't just look at whether someone clicked. We look at how long they stayed, what they did next, and whether they came back." - YouTube Algorithm Team
Metric #4: Engagement Velocity
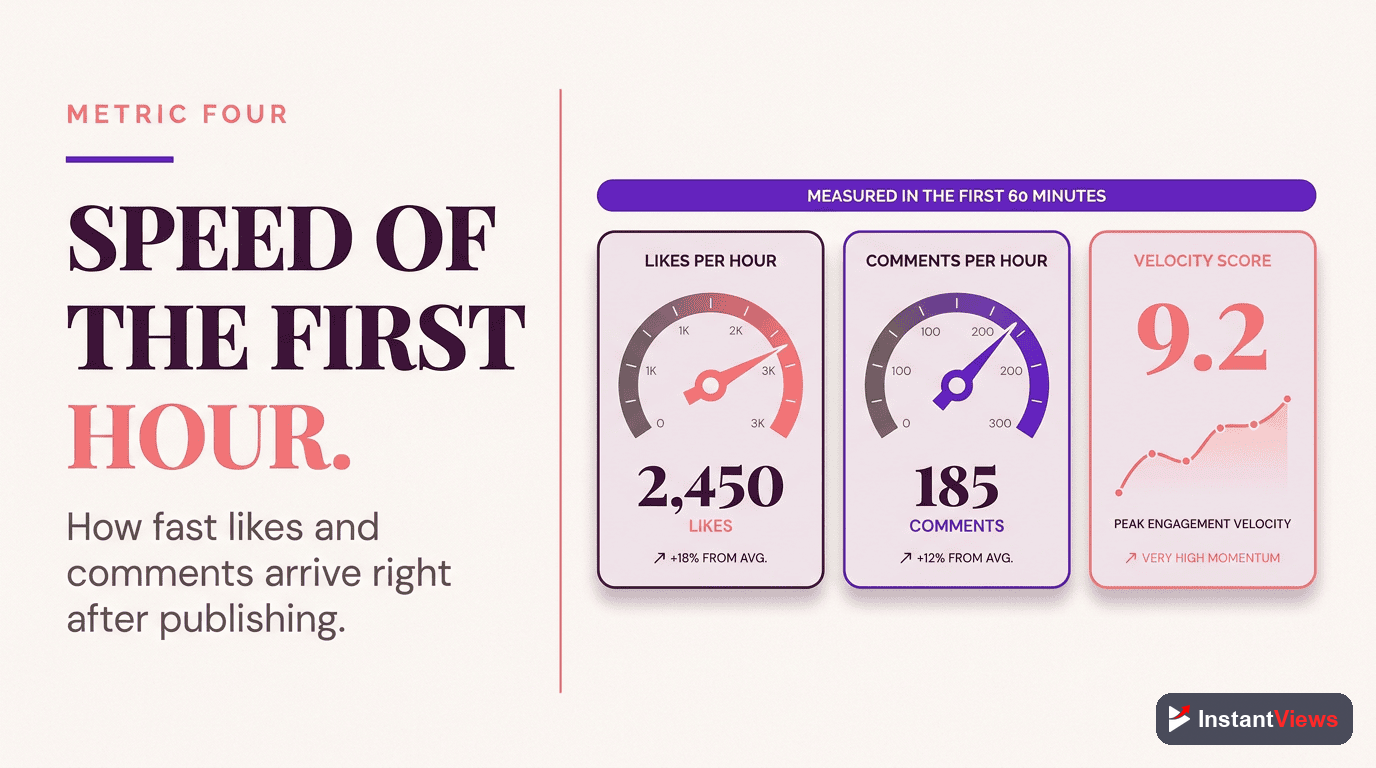
Engagement Velocity
The rate of likes, comments, and shares per view in the first 24 hours. Velocity measures audience enthusiasm and predicts viral potential better than raw engagement numbers.
Average: 3-5 engagements | Good: 6-8 | Excellent: 10+
What it predicts: High velocity indicates passionate audience response. Videos with strong velocity get priority in recommendations and notifications because they generate community activity.
How to calculate:
Velocity = (Likes + Comments × 2 + Shares × 3) / Views × 100
Comments and shares weigh more because they require greater effort and signal stronger connection.
How to read it:
- Below 3: Passive viewing. Content is consumed but doesn't inspire action.
- 3-6: Healthy engagement. Viewers find value but aren't highly motivated to interact.
- 6-10: Strong connection. Your content resonates emotionally or intellectually.
- Above 10: Exceptional. Viewers are actively promoting and discussing your content.
Metric #5: Watch Time Trend
Watch Time Trend
The trajectory of total watch time hour-over-hour. A rising trend predicts algorithmic momentum; a flat or declining trend signals the video has peaked.
Hour 1: 100 hours → Hour 6: 800 hours → Hour 24: 4,000 hours (exponential growth)
What it predicts: Trend direction is more important than absolute numbers. A small channel gaining momentum (100 → 200 → 400 hours) has better prospects than a large channel declining (1000 → 800 → 600 hours).
How to read it:
- Exponential growth: Algorithm is actively promoting. Keep momentum with community engagement.
- Linear growth: Steady performance. Standard algorithmic treatment without special promotion.
- Plateauing: Video has reached its natural audience. Consider promotion or optimization.
- Declining: Algorithm is reducing impressions. Analyze why and apply lessons to next video.
Metric #6: Engagement Rate
Engagement Rate
The percentage of viewers who like, comment, or share. This metric predicts community strength and content shareability, which influences recommendations and search ranking.
Average: 2-4% | Good: 4-6% | Excellent: 6%+
What it predicts: High engagement rate signals content quality and community loyalty. It predicts long-term channel growth and subscriber conversion better than views alone.
How to calculate:
Engagement Rate = (Total Engagements / Total Views) × 100
How to read it:
- Below 2%: Weak connection. Content may be informative but not engaging emotionally.
- 2-4%: Average engagement. Viewers consume but don't strongly interact.
- 4-6%: Strong community response. Content creates connection and discussion.
- Above 6%: Exceptional. Your audience is highly invested and active.
Predict Your Video Performance
Analyze your video before uploading to forecast engagement metrics and identify optimization opportunities.
Try Video Analyzer →
Combining Metrics for Accuracy
Individual metrics tell part of the story. Combining them creates a complete picture:
| Metric Combination | Prediction | Action |
|---|---|---|
| High CTR + Low Retention | Clickbait or mismatched expectations | Align thumbnail/title with actual content |
| Low CTR + High Retention | Good content, poor packaging | Improve thumbnail and title design |
| High CTR + High Retention | Viral potential - everything aligned | Promote aggressively, engage with comments |
| High AVD + Low Velocity | Valuable content, passive audience | Add calls-to-action, pose questions |
| High Velocity + Low AVD | Controversial or polarizing topic | Focus on depth to convert clicks to watch time |
| All Metrics High | Exceptional performance - replicate formula | Document approach, analyze what worked |
The Prediction Formula
For a quick performance score, use this weighted formula:
Performance Score = (CTR × 0.2) + (30s Retention × 0.35) + (AVD% × 0.25) + (Engagement Rate × 0.2)
Example calculation:
- CTR: 8% × 0.2 = 1.6
- 30s Retention: 75% × 0.35 = 26.25
- AVD: 55% × 0.25 = 13.75
- Engagement Rate: 4% × 0.2 = 0.8
- Total Score: 42.4/100
Score interpretation:
- Below 30: Underperforming. Analyze weaknesses and improve next video.
- 30-45: Average performance. Meeting baseline but not excelling.
- 45-60: Strong performance. Algorithm is promoting actively.
- Above 60: Exceptional. Document and replicate this approach.
Using Predictions to Optimize
Prediction metrics aren't just for watching numbers - they guide strategy:
1. Identify Your Winning Formula
Track prediction scores for every video. When you hit 55+ scores, analyze:
- What hook style did you use?
- What topic and angle?
- What thumbnail/title approach?
- What pacing and structure?
Double down on elements that consistently predict success.
2. Fix Problems Early
If 24-hour metrics show problems:
- Low CTR: Test a new thumbnail (you can change it without hurting the video)
- Low retention: Add cards to pull viewers to better-performing videos
- Low engagement: Add a pinned comment with a question to spark discussion
3. Validate Ideas Before Filming
Use the InstantViews Video Analyzer to test concepts:
- Input potential titles and thumbnails
- Compare predicted CTR scores
- Choose the highest-scoring concept before investing production time
4. Build Predictive Benchmarks
Create your own channel-specific benchmarks:
- Average your top 10% performing videos across all metrics
- Use these as your personal "good" benchmark
- Aim to match or exceed these numbers with each new video
Don't chase metrics at the expense of value. Clickbait titles and misleading thumbnails may boost CTR temporarily but destroy retention and long-term channel growth. Build trust through alignment.
Advanced Prediction Techniques
Traffic Source Analysis
Metrics vary by traffic source. After 48 hours, check which sources drive the best metrics:
- Browse features: Requires exceptional CTR (8%+) and strong retention
- Suggested videos: Needs high AVD and watch time to compete
- Search: Relies on CTR and satisfying search intent quickly
- External: Often lower retention but can drive viral growth
Optimize based on where your best traffic comes from.
Cohort Comparison
Compare new viewer metrics vs. returning viewers:
- If new viewers have higher retention, your content appeals broadly (good for growth)
- If returning viewers have higher retention, you're serving your niche (good for loyalty)
- Both high means you've found scalable, quality content
Time-of-Day Patterns
Track when your best-performing videos were published. Some channels see significantly better metrics from morning uploads, others from evening. Test systematically and use data to optimize timing.

Frequently Asked Questions
Engagement prediction metrics are data points that help forecast how well a video will perform before or shortly after publishing. They include CTR trends, early retention rates, watch time velocity, and engagement ratios that historically correlate with video success.
When using multiple metrics together, predictions can be 70-85% accurate within the first 48 hours. Individual metrics are less reliable, but combining CTR, AVD, engagement rate, and velocity creates a strong predictive model.
No single metric predicts everything, but early retention rate (first 30 seconds) is the strongest individual predictor. Videos that retain 70%+ of viewers in the first 30 seconds typically outperform by 3-5x.
Check initial metrics at 1 hour, 6 hours, 24 hours, and 48 hours after publishing. The first 24 hours show strong predictive signals, but wait 48-72 hours before making major decisions about promotion or optimization.
Yes. You can update thumbnails, titles, and descriptions to improve CTR. Pinned comments, cards, and end screens can boost engagement. However, retention issues require fixing in your next video since you cannot edit the content.
Track which video elements correlate with high prediction scores. If videos with certain hooks, pacing, or topics consistently show strong early metrics, double down on those patterns. Use the InstantViews Video Analyzer to identify winning formulas.