- Content quality is the most important YouTube ranking factor, combining technical, content, and engagement metrics
- High-quality videos achieve 50%+ average view duration and 8%+ click-through rates
- Technical metrics (resolution, audio quality, production value) establish baseline quality standards
- Content value (uniqueness, depth, actionability) determines viewer satisfaction and retention
- Engagement signals (watch time, likes, comments) indicate quality to YouTube's algorithm
- Use InstantViews Video Analyzer for comprehensive quality scoring and optimization recommendations
In the age of algorithm-driven content discovery, quality is the only sustainable competitive advantage on YouTube. But what exactly defines "quality" in the eyes of YouTube's algorithm, and how can you measure it objectively?
Most creators focus on vanity metrics - views, subscribers, likes. But YouTube's recommendation system evaluates content quality using dozens of sophisticated signals that go far beyond these surface-level numbers.
This comprehensive guide breaks down the complete framework for measuring YouTube content quality, from technical production values to engagement patterns that signal exceptional content.
What Defines Video Quality on YouTube?
Video quality on YouTube isn't just about 4K resolution or expensive cameras. It's a multi-dimensional assessment that YouTube's algorithm performs on every video using three core pillars:
The Three Pillars of YouTube Quality
Technical Quality
The production values that make your video watchable: video resolution, bitrate, audio clarity, lighting, framing, editing precision, and overall polish.
Resolution (1080p+), audio levels (-14 LUFS target), bitrate (8+ Mbps for 1080p), frame rate (24-60fps), color grading, visual stability
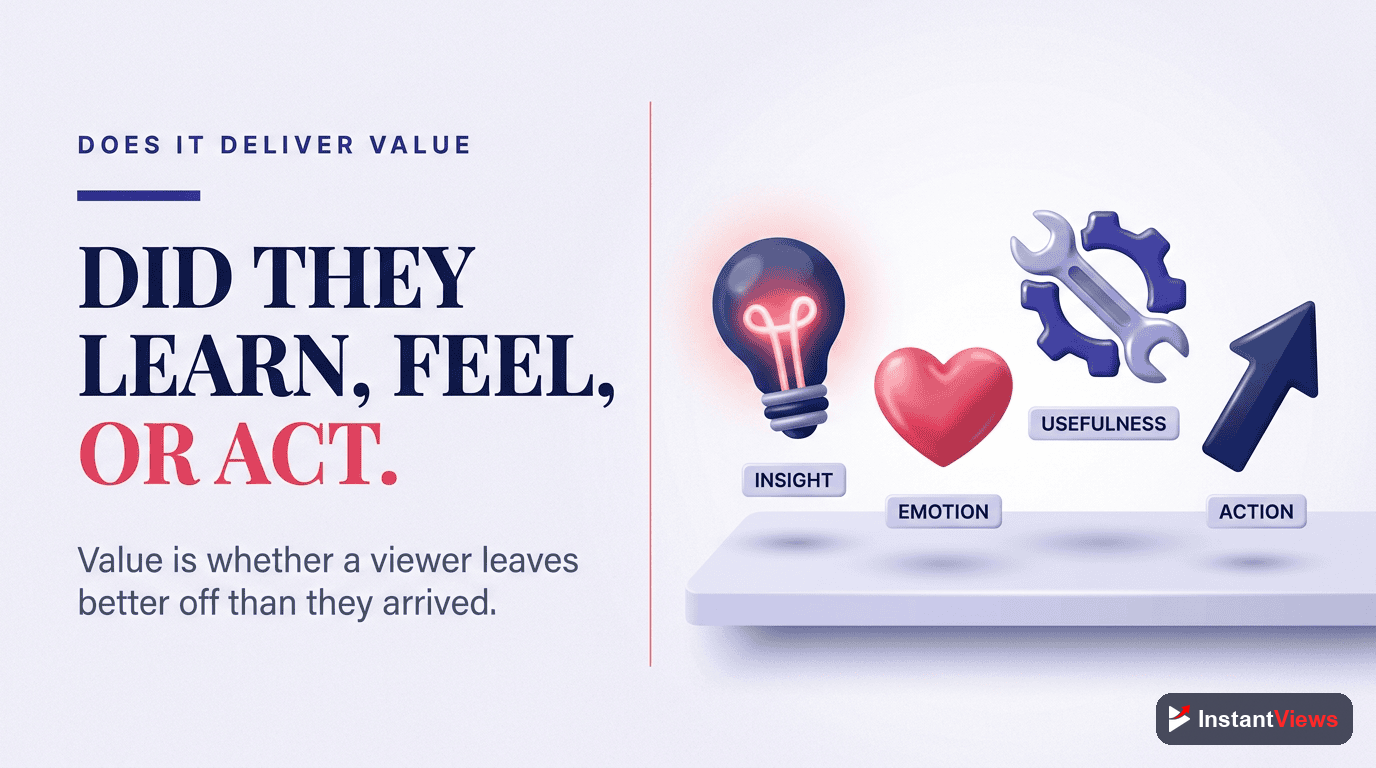
Content Value
The substance and usefulness of your content: information depth, accuracy, uniqueness, actionability, relevance to viewer intent, and overall educational or entertainment value.
Topic coverage depth, unique insights provided, practical takeaways, source credibility, content freshness, expertise demonstration
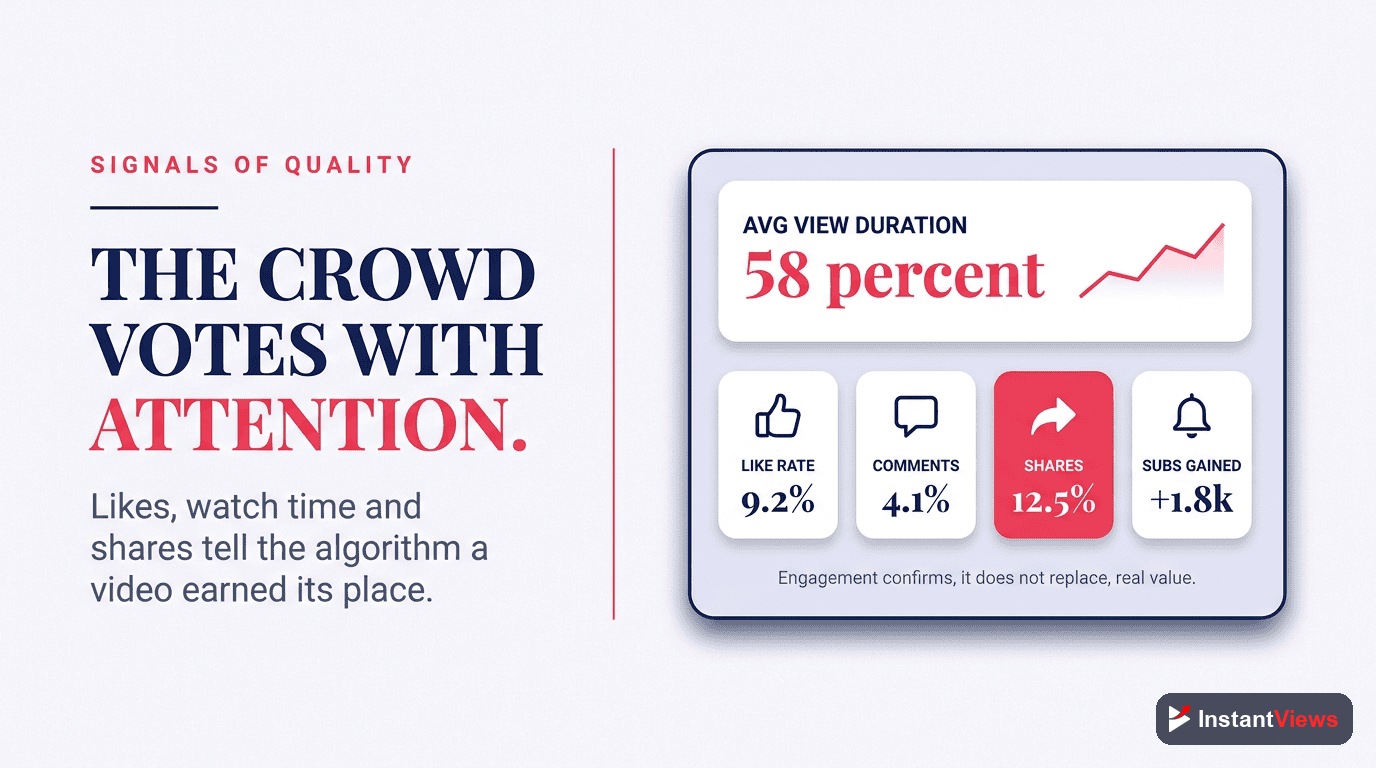
Engagement Performance
How viewers actually interact with your content: watch time, retention rate, likes, comments, shares, click-through rate, and session watch time impact.
Average view duration, retention curve, CTR, engagement rate, repeat viewers, session time, velocity metrics
High-quality content excels across all three pillars. A video with perfect technical quality but poor content value won't perform. Similarly, great content with terrible audio will struggle to retain viewers.

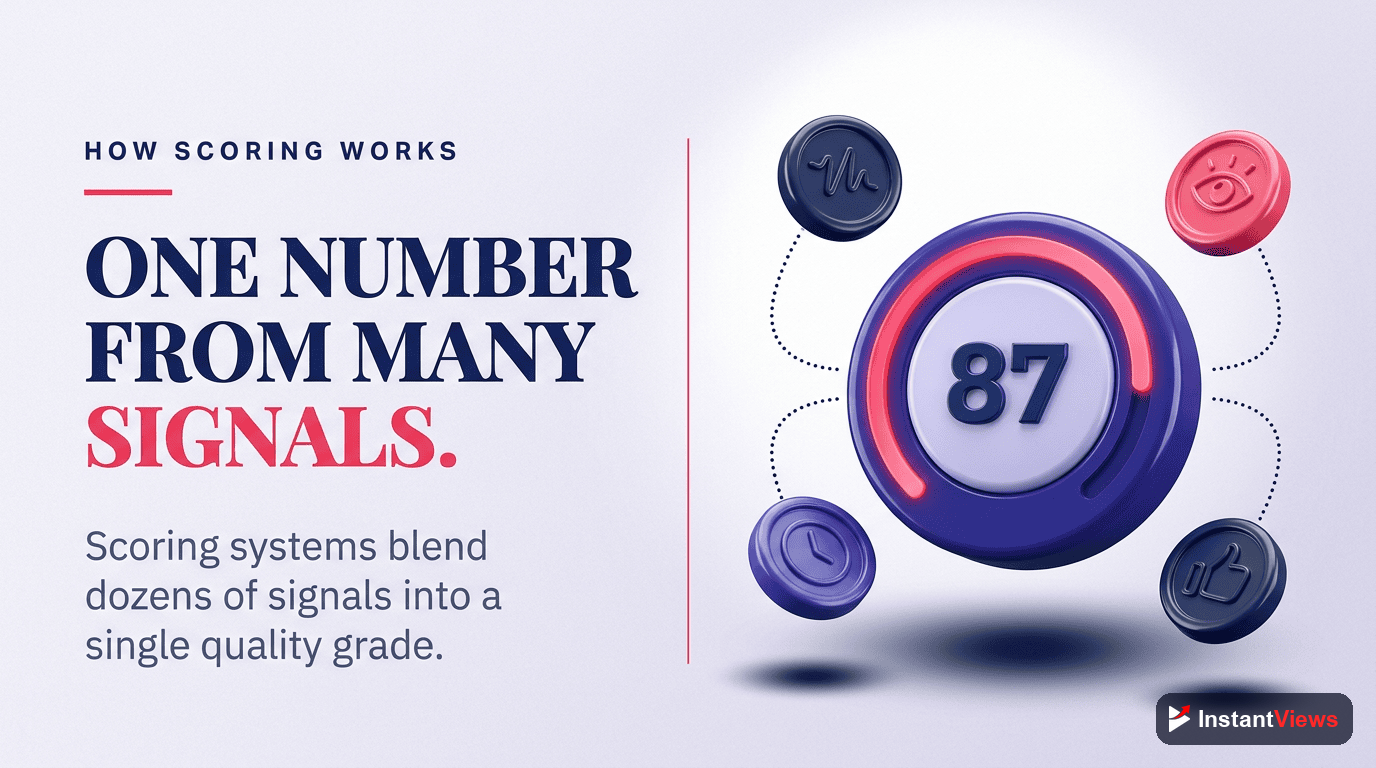
Quality Scoring Systems Explained
To objectively measure quality, you need a scoring system that combines multiple metrics into a single, actionable quality score.
The Weighted Quality Score Formula
Professional YouTube analytics tools use weighted formulas to calculate overall quality scores. Here's the standard approach:
Quality Score = (Technical × 0.25) + (Content × 0.35) + (Engagement × 0.40)

Where:
- Technical Score = Average of resolution, audio, production metrics (0-100)
- Content Score = Depth, uniqueness, value metrics (0-100)
- Engagement Score = Watch time, CTR, retention metrics (0-100)
Notice that engagement carries the highest weight (40%). This reflects YouTube's primary goal: keeping viewers on the platform longer.
Quality Score Ranges and Interpretation
| Score Range | Quality Level | Performance Expectations |
|---|---|---|
| 85-100 | Exceptional | High viral potential, strong algorithmic promotion, recommended frequently |
| 70-84 | High Quality | Good algorithm performance, consistent recommendations, strong retention |
| 55-69 | Above Average | Moderate algorithm support, decent performance, room for improvement |
| 40-54 | Average | Limited algorithmic promotion, relies on existing audience |
| Below 40 | Needs Improvement | Poor algorithm performance, low recommendations, requires optimization |
"Videos scoring above 70 in our quality system receive 4x more impressions from YouTube's recommendation algorithm compared to videos scoring below 50." - InstantViews Analytics Data
Audio and Video Quality Metrics
Technical quality establishes the baseline watchability of your content. Poor technical quality causes immediate viewer drop-off, regardless of content value.
Video Quality Metrics
Resolution and Clarity
- Minimum standard: 1080p (1920×1080) at 30fps
- Recommended: 1080p at 60fps or 4K at 30fps
- Bitrate: 8 Mbps minimum for 1080p, 35-45 Mbps for 4K
- Codec: H.264 or H.265 for optimal compatibility and quality
Visual Production Elements
- Lighting: Consistent, well-lit scenes without harsh shadows or overexposure
- Framing: Rule of thirds composition, subject properly positioned
- Stability: Smooth camera work, gimbal/tripod stabilization
- Color grading: Consistent color palette, professional color correction
- Editing: Clean cuts, appropriate transitions, dynamic pacing
Audio Quality Metrics
Audio quality is often more important than video quality. Viewers will tolerate lower resolution video, but poor audio causes immediate abandonment.
Critical Audio Specifications
| Metric | Target Value | Impact |
|---|---|---|
| Loudness (LUFS) | -14 LUFS ±1 | Consistent volume across YouTube, no viewer volume adjustments needed |
| Sample Rate | 48kHz | Professional standard, captures full frequency range |
| Bitrate | 320kbps (stereo) | High fidelity, no compression artifacts |
| Background Noise | < -60dB | Clean audio, professional sound quality |
| Dynamic Range | -20dB to -1dB | Natural sound, appropriate compression |
The #1 audio mistake is inconsistent volume levels. Viewers abandon videos where they have to constantly adjust volume. Use audio compression and normalization to maintain consistent levels throughout your video.
Production Quality Assessment
Beyond raw technical specs, overall production polish matters:
- Editing quality: Tight cuts, removal of dead air, appropriate B-roll
- Graphics and overlays: Professional lower thirds, consistent branding
- Visual effects: Subtle, purpose-driven, not distracting
- Transitions: Smooth, intentional, not overused
- Pacing: Dynamic editing that maintains viewer interest (see our video pacing guide)
Analyze Your Video Quality
Get instant technical quality assessment, content scoring, and engagement predictions with our Video Analyzer tool.
Analyze Your Video →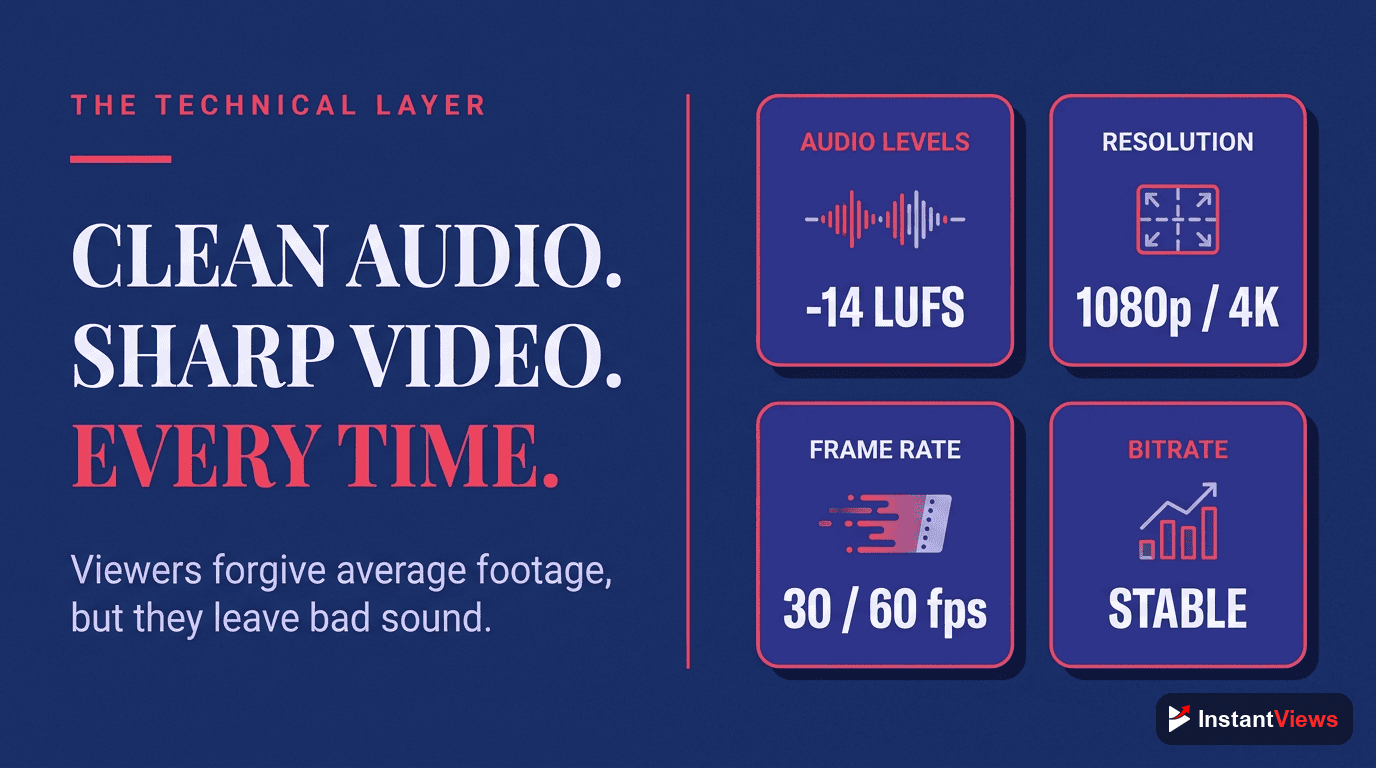
Content Value Metrics
Content value is the hardest quality dimension to measure objectively, but it's what ultimately determines whether viewers find your content worth their time.
Information Depth and Coverage
High-value content thoroughly covers topics without fluff or padding:
- Topic comprehensiveness: Answers primary question plus related sub-questions
- Information density: Value per minute (no unnecessary repetition)
- Structured presentation: Logical flow with clear sections (use YouTube chapters)
- Examples and evidence: Concrete illustrations, data, case studies
- Actionability: Clear next steps viewers can implement
Content Uniqueness and Originality
YouTube prioritizes original content over rehashed information:
Original Research and Insights
Content based on personal experience, original testing, or unique data stands out. Generic "top 10 tips" videos rank poorly unless they offer genuinely new perspectives.
Instead of "Best YouTube SEO Tips" (generic), create "I Analyzed 10,000 YouTube Videos - Here's What Actually Ranks" (original research)
Unique Presentation Style
Even if covering common topics, a distinctive presentation style creates differentiation. This includes visual style, personality, teaching approach, or format innovation.
Specialized Expertise
Content from recognized experts or practitioners with proven experience carries higher value than surface-level coverage from generalists.
Content Accuracy and Credibility
Misinformation or low-accuracy content gets penalized:
- Fact-checking: Verified information, cited sources
- Current information: Up-to-date data, not outdated advice
- Balanced perspective: Acknowledges limitations and nuances
- Expertise signals: Demonstrated knowledge, credentials, results
Viewer Intent Matching
Quality content precisely matches what viewers expect based on the title and thumbnail:
- Title accuracy: Content delivers on the promise made in the title
- No clickbait: Thumbnail and title accurately represent content
- Search intent alignment: Answers the specific question viewers searched for
- Value density: Gets to the point quickly, no excessive intro fluff
Engagement as Quality Indicator
Engagement metrics are the most powerful quality signals because they reflect actual viewer satisfaction. YouTube's algorithm heavily weights these metrics.
Watch Time and Retention
The single most important quality metric is how long viewers actually watch:
Average View Duration (AVD)
- What it measures: Average time viewers watch before leaving
- Quality benchmark: 50%+ of video length for videos over 8 minutes
- Algorithm impact: Primary ranking factor for search and recommendations
- Improvement focus: Stronger hooks, better pacing, clear value delivery
Audience Retention Curve
The retention curve shows exactly where viewers drop off. High-quality videos maintain retention throughout:
| Video Section | Quality Target | What It Indicates |
|---|---|---|
| 0-15 seconds | 80%+ retention | Strong hook, compelling intro, no bait-and-switch |
| First minute | 65%+ retention | Clear value proposition, engaging presentation |
| Mid-video | 50%+ retention | Sustained interest, good pacing, no dead spots |
| Final 25% | 40%+ retention | Payoff delivered, strong conclusion, CTA effectiveness |
Click-Through Rate (CTR)
CTR measures how compelling your packaging (title + thumbnail) is:
- Quality benchmark: 8%+ for most niches, 10%+ for competitive topics
- What it indicates: Title/thumbnail appeal, topic relevance, brand strength
- Balancing act: High CTR without retention = clickbait (penalized)
- Optimization: See our guide on thumbnail designs
Engagement Rate
Likes, comments, and shares indicate active viewer satisfaction:
Engagement Rate = (Likes + Comments + Shares) / Views × 100

Quality Benchmarks:
- 4%+ = Excellent (highly engaging content)
- 2-4% = Good (solid engagement)
- 1-2% = Average (room for improvement)
- < 1% = Poor (content not resonating)
Engagement Quality Signals
- Comment depth: Thoughtful comments vs. generic "nice video"
- Discussion generation: Comments replying to each other, debates
- Share context: Shares to specific communities vs. random sharing
- Save rate: Users saving to playlists for later (indicates high value)
Session Watch Time Impact
YouTube prioritizes videos that keep viewers on the platform longer:
- Session start: Videos that begin viewing sessions
- Session continuation: Videos that lead to more watching
- End screens effectiveness: Clicks to other videos, playlist additions
- Suggested video performance: How often your video leads to more watching
How InstantViews Video Analyzer Scores Content Quality
The InstantViews Video Analyzer provides comprehensive quality scoring by analyzing your videos across all key dimensions:
Multi-Dimensional Quality Assessment
Technical Quality Analysis
Automated assessment of video resolution, bitrate, audio levels, visual quality, and production values. Identifies specific technical improvements.
Audio quality score (0-100), video clarity rating, production polish assessment, specific equipment recommendations, audio normalization suggestions
Content Value Scoring
AI-powered analysis of content depth, uniqueness, structure, and value delivery. Compares against top-performing videos in your niche.
Content depth score, uniqueness rating, topic coverage assessment, pacing analysis, value-per-minute calculation, competitive benchmarking
Engagement Prediction
Predictive modeling of expected retention, CTR, and engagement based on title, thumbnail, content structure, and historical performance data.
Predicted AVD, estimated CTR, retention curve forecast, engagement rate prediction, optimization recommendations
Comprehensive Quality Report
The Video Analyzer generates detailed quality reports including:
- Overall quality score (0-100): Weighted combination of all quality factors
- Category breakdowns: Separate scores for technical, content, and engagement
- Competitive comparison: How your quality compares to top performers
- Improvement priorities: Ranked list of highest-impact optimizations
- Metadata optimization: Title, description, and tag recommendations
- Chapter suggestions: Optimal timestamp placement for retention
Get Your Quality Score
Analyze any YouTube video to get comprehensive quality scoring, competitive benchmarking, and specific optimization recommendations.
Analyze Video Now →
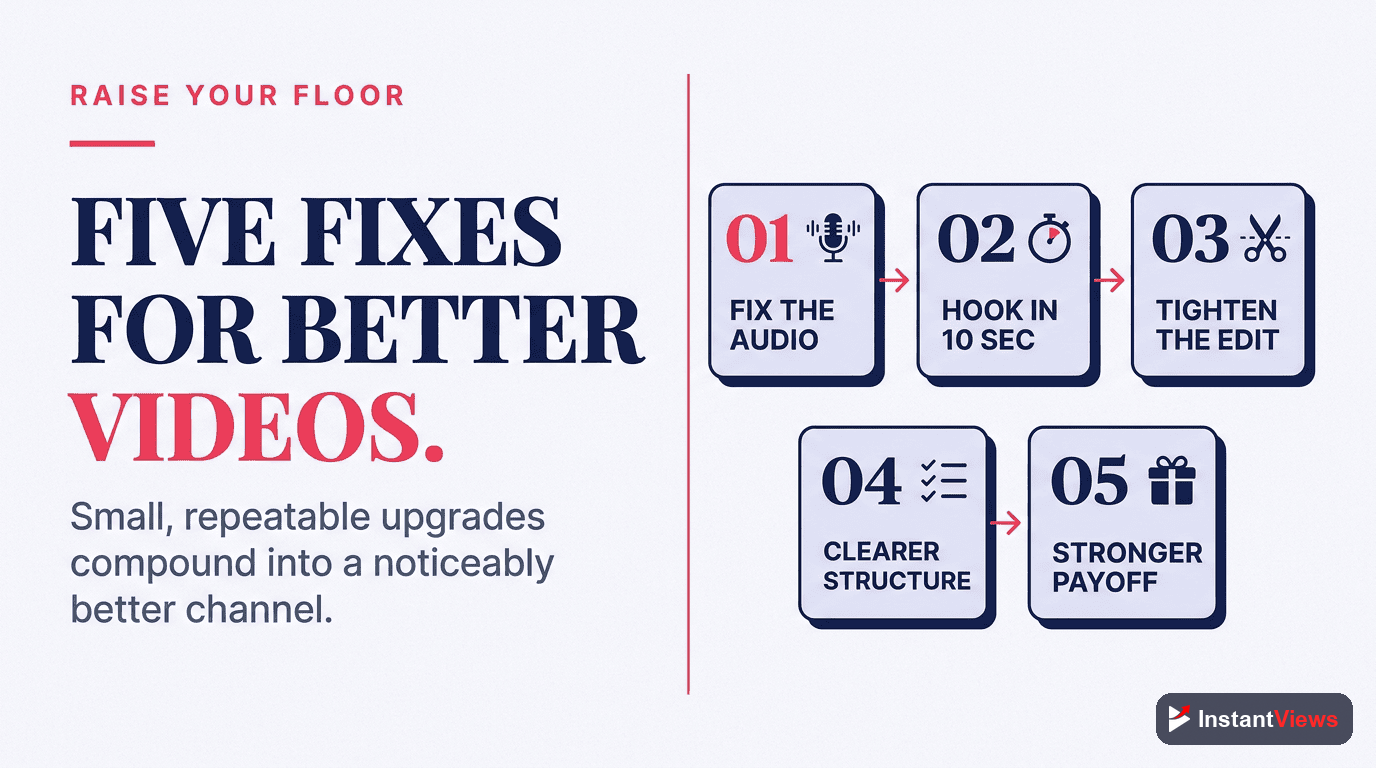
Quality Improvement Strategies
Once you understand your quality metrics, focus on systematic improvements:
Technical Quality Upgrades
Audio improvements (highest ROI):
- Invest in a quality microphone (Shure SM7B, Rode NT1, or similar)
- Use audio treatment (foam panels, bass traps) to reduce echo
- Learn basic audio mixing (compression, EQ, normalization)
- Record in quiet environments, minimize background noise
- See our microphone recommendations
Video improvements:
- Upgrade to 1080p minimum (4K if your niche values it)
- Invest in proper lighting (key, fill, back lights)
- Use camera stabilization (tripod, gimbal, or built-in stabilization)
- Learn color grading basics for professional look
Content Value Enhancement
Research depth:
- Conduct original research, tests, or experiments
- Interview experts or showcase unique perspectives
- Provide data-driven insights, not just opinions
- Create comprehensive guides that replace 10 mediocre videos
Structure optimization:
- Start with compelling hooks (first 15 seconds are critical)
- Use clear sections with chapters for SEO
- Deliver value early, don't bury the lead
- Maintain dynamic pacing throughout
- End with clear CTAs and next steps
Engagement Optimization
Retention improvements:
- Analyze retention curves to identify drop-off points
- Eliminate dead air and unnecessary segments
- Add pattern interrupts (B-roll, graphics) every 15-30 seconds
- Create open loops that promise value later in the video
- Use emotional peaks strategically
CTR improvements:
- A/B test thumbnails to find highest-performing designs
- Write curiosity-driven titles that match search intent
- Study top performers in your niche for packaging insights
- Ensure title and thumbnail work together, not separately
Quality Benchmarking and Comparison
Understanding your quality metrics in context requires competitive benchmarking:
Niche-Specific Quality Standards
Quality expectations vary significantly by niche:
| Niche | Technical Priority | Content Priority | Typical AVD |
|---|---|---|---|
| Educational/Tutorial | High (clear visuals) | Very High (depth) | 55-65% |
| Entertainment/Vlogs | Medium (personality focus) | Medium (entertainment value) | 40-50% |
| Tech Reviews | Very High (showcase product) | High (thoroughness) | 50-60% |
| Gaming | High (gameplay clarity) | Medium (commentary) | 35-45% |
| News/Commentary | Medium | High (unique perspective) | 45-55% |
Competitive Analysis Process
To benchmark effectively:
- Identify top performers: Find the top 10 videos for your target keywords
- Analyze their quality: Use Video Analyzer to score each competitor
- Find quality gaps: Identify where you can exceed competitor quality
- Set target scores: Aim to match or beat average top-10 quality score
- Track improvements: Monitor your quality scores over time
Quality Tracking Over Time
Monitor quality trends to ensure continuous improvement:
- Video-by-video tracking: Score each upload to identify patterns
- Category trends: Are you improving in technical, content, or engagement?
- Correlation analysis: Which quality factors most impact your performance?
- ROI measurement: Track how quality improvements affect views and growth
Frequently Asked Questions
YouTube content quality metrics are measurable indicators that assess the overall quality of your videos, including technical aspects (video/audio quality), content value (information depth, uniqueness), engagement signals (watch time, likes, comments), and viewer satisfaction. These metrics help creators understand how well their content performs and where improvements are needed.
YouTube uses a combination of automated systems and user signals to measure quality: technical analysis (resolution, bitrate, audio clarity), engagement metrics (watch time, retention, click-through rate), viewer feedback (likes, comments, shares), and behavioral signals (repeat views, session time). The algorithm prioritizes videos that demonstrate high quality across all these dimensions.
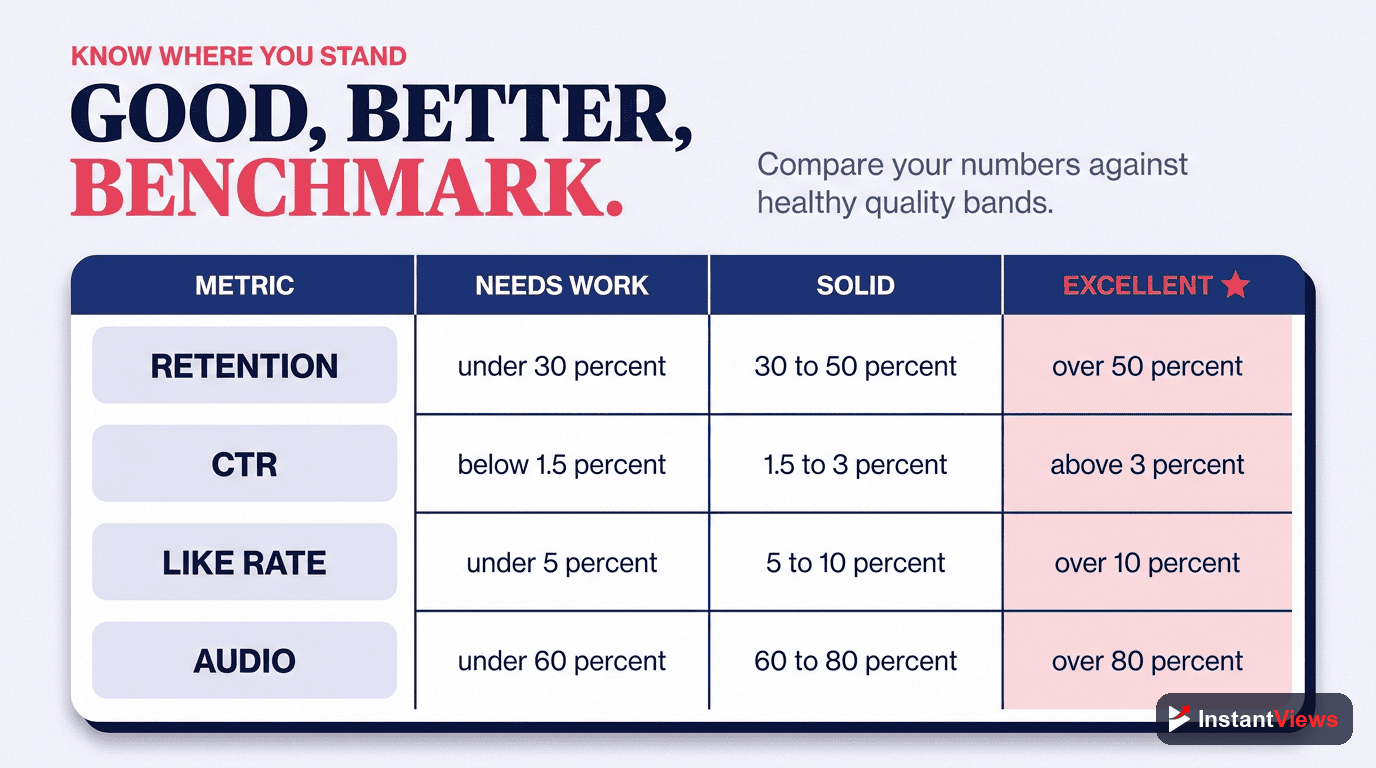
A good content quality score typically includes: 50%+ average view duration, 8%+ click-through rate, 4%+ engagement rate (likes/comments/shares), minimal dislikes or "not interested" feedback, and strong session watch time. Videos scoring high across these metrics are more likely to be recommended by YouTube's algorithm.
Improve content quality by: investing in better equipment (camera, microphone, lighting), structuring content for retention (strong hooks, clear pacing), adding value (unique insights, actionable advice), optimizing metadata (titles, descriptions, tags), encouraging engagement, and analyzing performance data to identify weak points. Use tools like InstantViews Video Analyzer to get specific recommendations.
Yes, significantly. YouTube's algorithm prioritizes high-quality content that keeps viewers on the platform. Videos with better technical quality, higher engagement, and stronger retention signals rank higher in search results and recommendations. Quality is one of the most important ranking factors, especially for competitive topics.
Several tools measure content quality: YouTube Studio Analytics (built-in metrics), InstantViews Video Analyzer (comprehensive quality scoring), TubeBuddy (SEO and engagement analysis), VidIQ (competitor benchmarking), and third-party audio/video analysis tools. The InstantViews Video Analyzer provides the most comprehensive quality assessment with actionable recommendations.