- Average View Duration (AVD) is the single most important metric for YouTube algorithm success
- CTR and AVD work together - both must be strong for a video to get recommended widely
- Audience retention graphs reveal exactly where viewers lose interest in your content
- Traffic source data shows which discovery methods work best for your content type
- The first 48 hours of performance data predict long-term video success
YouTube Analytics can feel overwhelming. Hundreds of data points, confusing graphs, and metrics that seem to contradict each other. But here's the truth: only a handful of metrics actually matter for growing your channel.
This guide cuts through the noise. We'll focus on the metrics that directly influence YouTube's algorithm, how to interpret them correctly, and what actions to take based on your data.
After analyzing over 10,000 YouTube channels, we've identified the exact metrics that separate growing channels from stagnant ones. Let's dive in.
- Why Analytics Matter for Algorithm Success
- Metric #1: Click-Through Rate (CTR)
- Metric #2: Average View Duration (AVD)
- Metric #3: Audience Retention
- Metric #4: Impressions & Impressions CTR
- Metric #5: Traffic Sources
- Metric #6: Engagement Rate
- How to Interpret Your Data
- Taking Action Based on Analytics
- FAQ
Why Analytics Matter for Algorithm Success
YouTube's algorithm has one primary goal: maximize total watch time on the platform. Every recommendation decision comes down to predicting which videos will keep viewers on YouTube longest.
Your analytics reveal how well your videos achieve this goal. When you understand what the algorithm values, you can optimize for it systematically.
YouTube doesn't care about views, subscribers, or even likes. It cares about watch time. Every metric we'll discuss either directly measures watch time or predicts it.

Metric #1: Click-Through Rate (CTR)
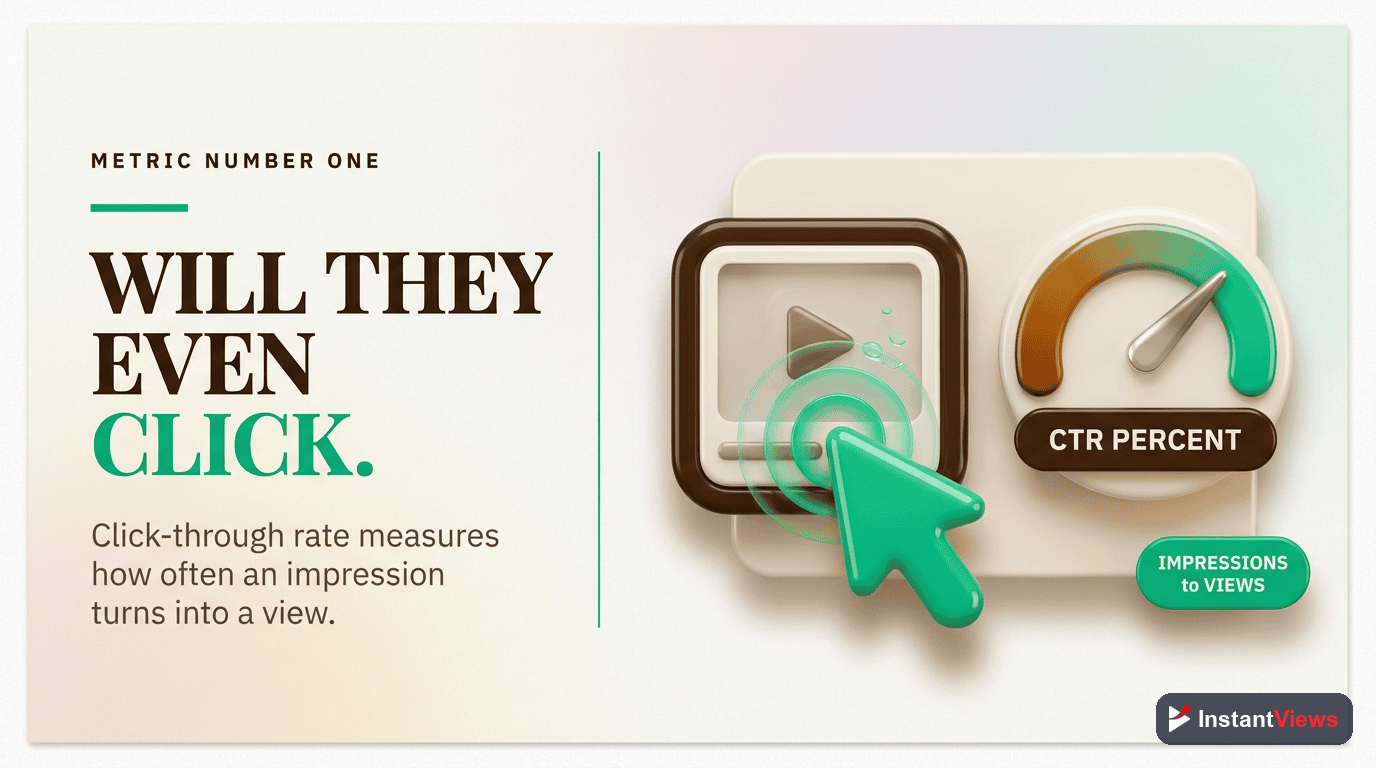
Click-Through Rate (CTR)
The percentage of people who click on your video after seeing your thumbnail. This measures how compelling your packaging (thumbnail + title) is.
What it tells you: CTR reveals whether your thumbnail and title are effective at capturing attention. Low CTR means viewers scroll past your video. High CTR means your packaging is compelling.
Common misconceptions:
- "My CTR is low, so I need better thumbnails" - Not necessarily. CTR varies dramatically by traffic source. Homepage CTR is typically lower than suggested video CTR.
- "Higher CTR is always better" - False. A 15% CTR with 30% AVD loses to 6% CTR with 60% AVD. Balance matters.
- "I should optimize for maximum CTR" - No. Optimize for accurate CTR that attracts the right audience who will actually watch.
Metric #2: Average View Duration (AVD)
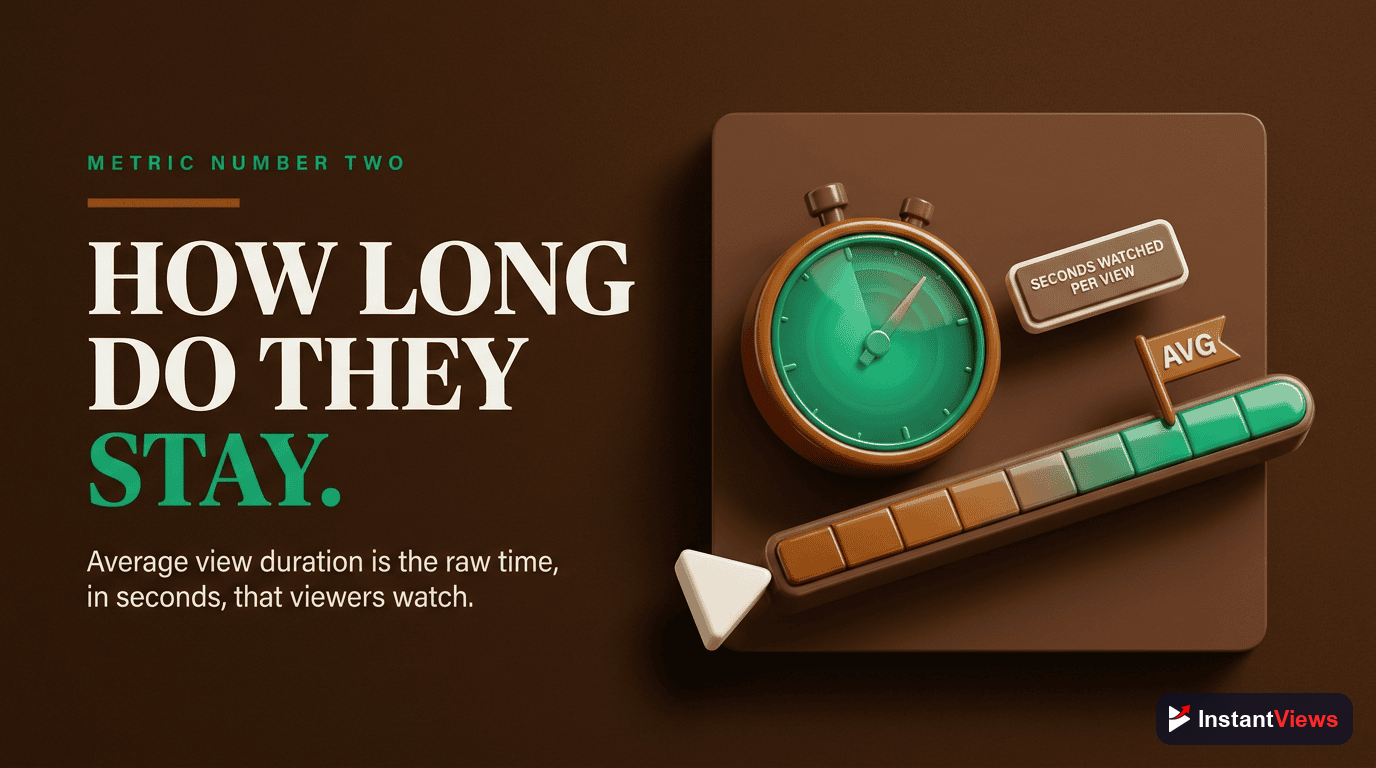
Average View Duration (AVD)
The average amount of time viewers spend watching your video. This is the single most important metric for algorithm performance.
What it tells you: AVD directly measures content quality from YouTube's perspective. High AVD signals that viewers found your content valuable. Low AVD indicates the content didn't match expectations or lost viewer interest.
Why it matters most: YouTube's algorithm optimizes for total platform watch time. A video with high AVD generates more watch time per view, making it more valuable to recommend. This creates a compounding effect - better AVD leads to more impressions, which leads to more views.
The AVD Calculation Myth
Many creators misunderstand AVD. It's not just about video length. A 3-minute video with 2:00 AVD (67%) outperforms a 10-minute video with 4:00 AVD (40%) in the algorithm.
Focus on percentage watched, not absolute time.
Metric #3: Audience Retention
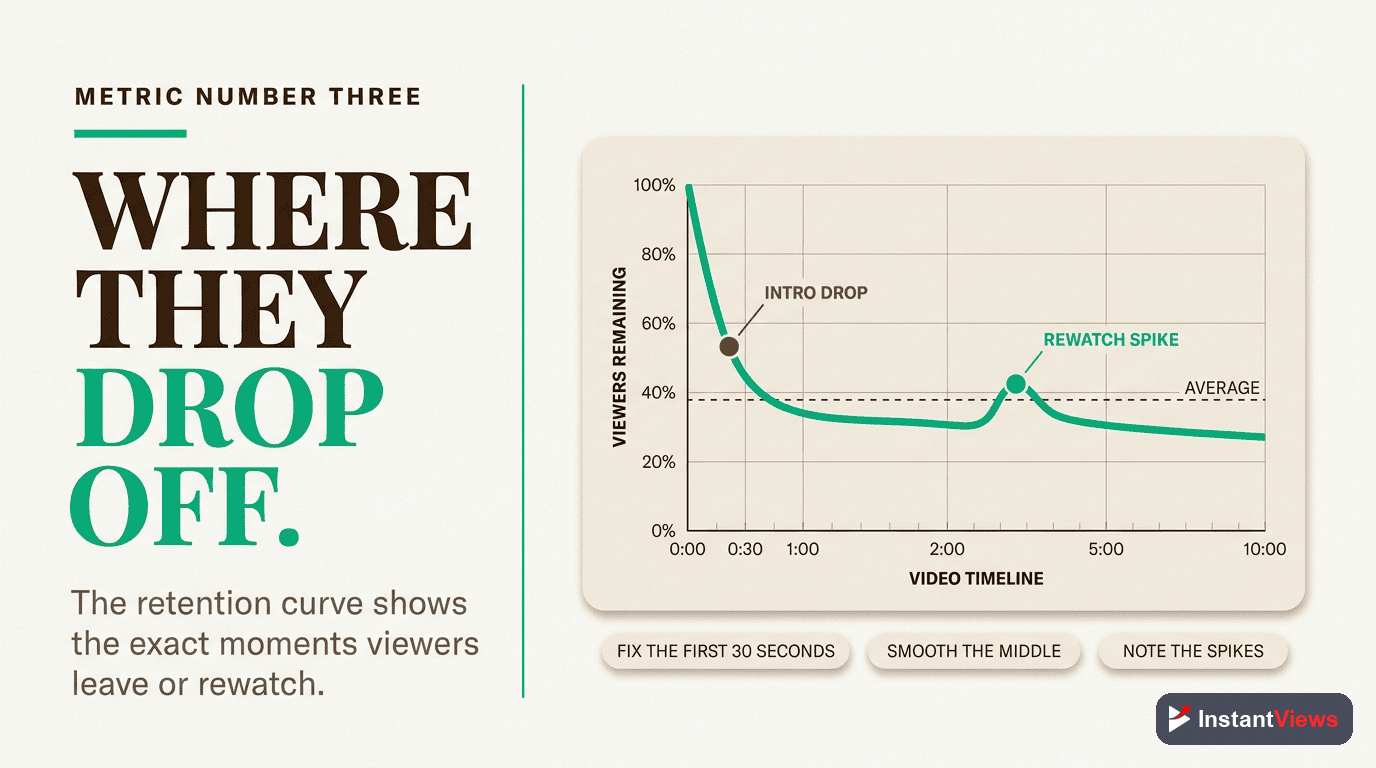
Audience Retention Graph
A visual representation showing the exact percentage of viewers still watching at each moment in your video. This reveals exactly where and why viewers leave.
The audience retention graph is your video autopsy. It shows you:
- Hook effectiveness - The first 30 seconds reveal if your hook works
- Pacing problems - Steep drops indicate boring segments
- Content peaks - Spikes show what viewers find most valuable
- Outro performance - Whether viewers watch to the end
Reading Retention Graphs
Look for these patterns:
| Pattern | What It Means | Action Needed |
|---|---|---|
| Steep drop at start | Hook failed to engage | Improve first 30 seconds |
| Gradual decline | Normal, acceptable pattern | Maintain current approach |
| Sharp mid-video drop | Boring segment or false promise | Cut that section, improve pacing |
| Spike upward | Viewers rewatching valuable moment | Create more content like this |
| Flat retention | Exceptional engagement | Study and replicate this video |
| Drop at specific timestamp | Predictable outro or sponsorship | Consider placement timing |
"The retention graph is the most honest feedback you'll ever get. Viewers vote with their attention, and the graph shows you exactly where you lost their vote."
Metric #4: Impressions & Impressions CTR
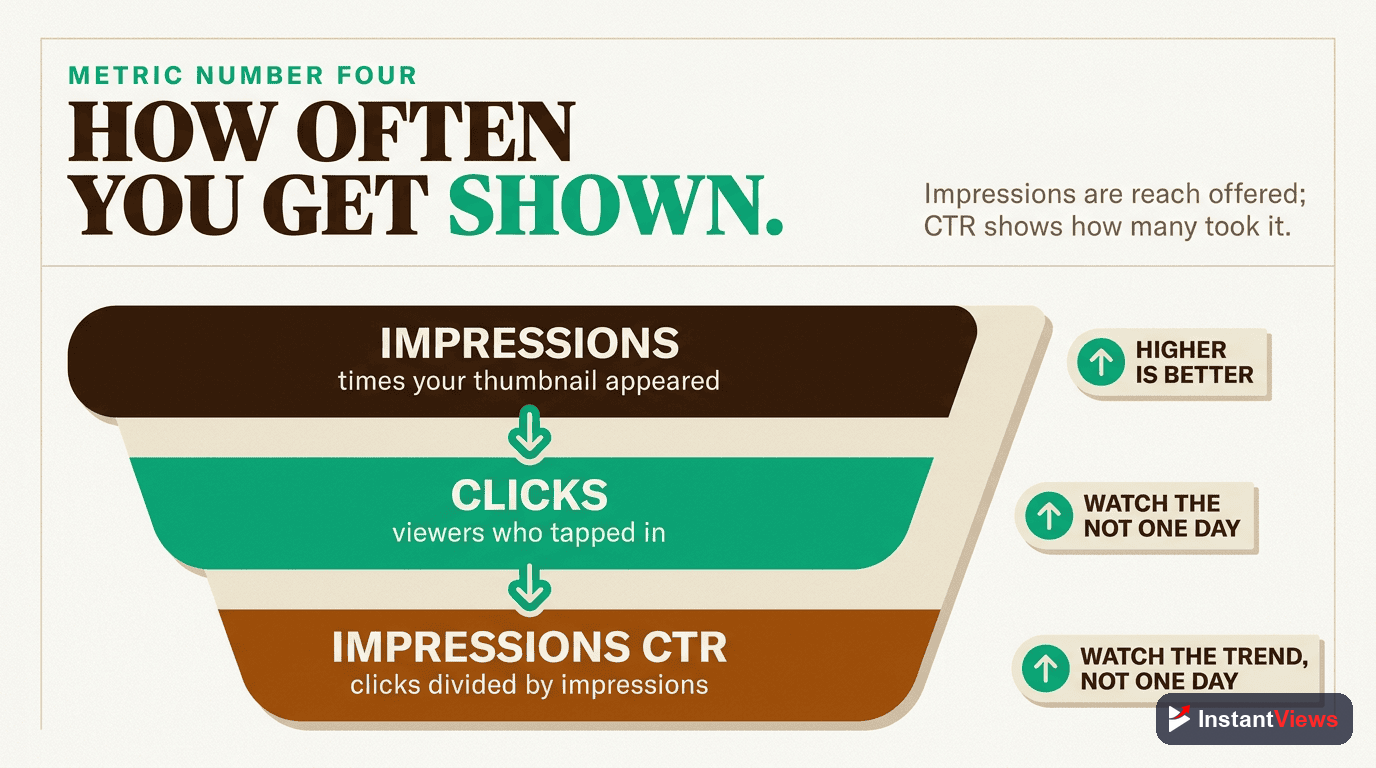
Impressions
The number of times your thumbnail was shown to potential viewers on YouTube. This measures how widely YouTube is distributing your video.
What impressions tell you: Impressions indicate YouTube's confidence in your video. High impressions mean YouTube is actively recommending it. Low impressions mean the algorithm is being cautious.
The Impressions Lifecycle
Typical impression patterns for successful videos:
- Hours 0-2: Subscribers and homepage, low impressions (hundreds to low thousands)
- Hours 2-24: Initial testing phase, impressions increase if CTR/AVD are good
- Days 1-3: Exponential growth if metrics stay strong
- Days 3-7: Peak impressions if video proves successful
- Week 2+: Gradual decline or sustained "evergreen" impressions
Low impressions aren't always bad. If you have 1,000 impressions with 15% CTR and 70% retention, YouTube will rapidly increase impressions. Quality metrics drive impression growth.
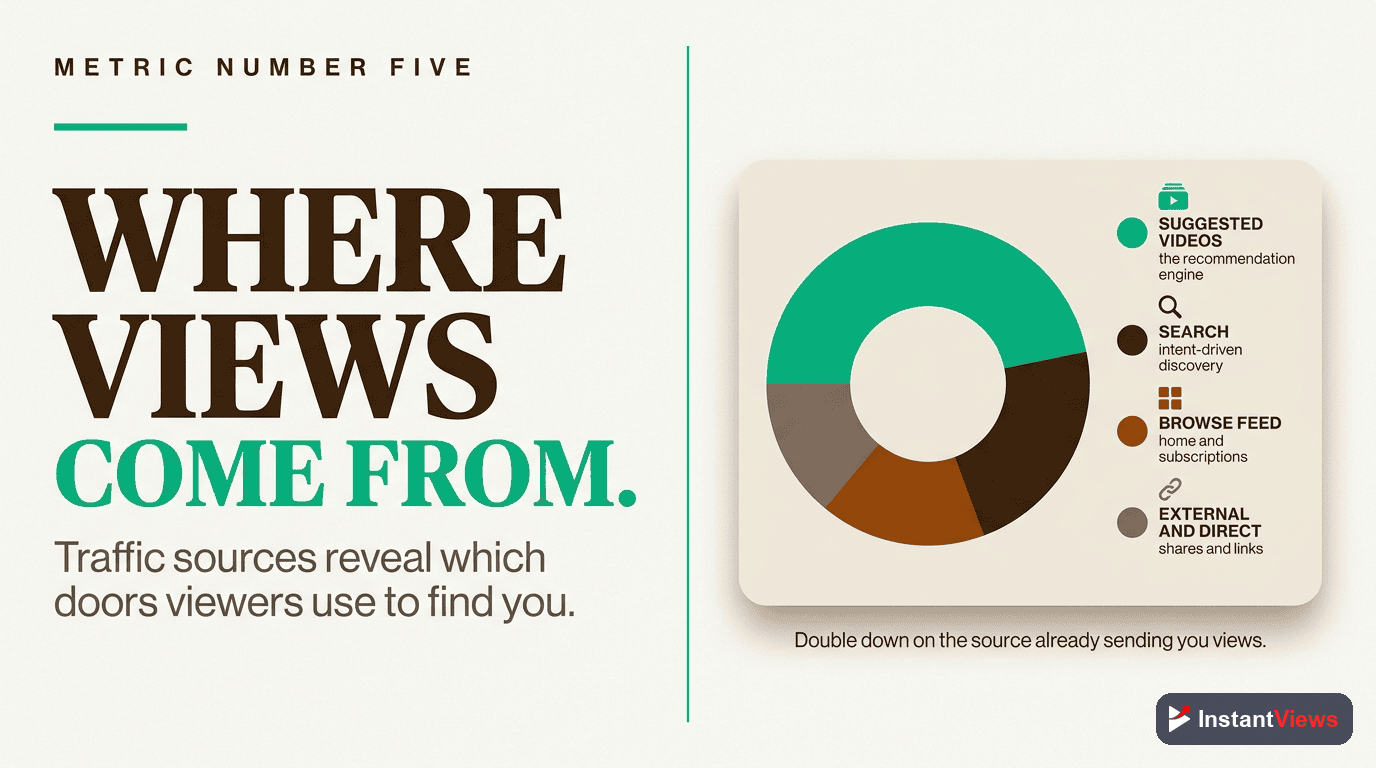
Metric #5: Traffic Sources
Traffic Sources
Shows where your viewers are discovering your videos: Browse Features (homepage), Suggested Videos, YouTube Search, External, etc.
What traffic sources reveal:
- Browse Features: Homepage recommendations - indicates YouTube is actively pushing your video
- Suggested Videos: Sidebar and end screen recommendations - shows your video pairs well with others
- YouTube Search: Direct searches - indicates strong SEO and evergreen value
- Channel Pages: Subscribers browsing your channel
- External: Social media, websites, embeds
- Playlists: Your video is included in playlists
Optimizing for Different Traffic Sources
| Traffic Source | What Drives It | How to Optimize |
|---|---|---|
| Browse Features | High CTR + AVD on similar videos | Eye-catching thumbnails, trending topics |
| Suggested Videos | Topic relevance, strong retention | Reference popular videos, optimize metadata |
| YouTube Search | SEO, keyword optimization | Title keywords, detailed descriptions |
| Channel Pages | Subscriber loyalty | Consistent upload schedule, clear branding |
| External | Social sharing, embeds | Shareable content, social media promotion |
Metric #6: Engagement Rate
Engagement Rate
Likes, comments, shares, and saves relative to views. While not a primary ranking factor, engagement signals viewer satisfaction and creates social proof.
Why engagement matters (but not as much as you think):
YouTube has stated engagement is a minor ranking signal compared to CTR and watch time. However, engagement still matters because:
- Comments increase total session time on your video page
- Shares can drive additional traffic sources
- High engagement signals passionate audience connection
- Social proof influences CTR for new viewers
Engagement Benchmarks
- Like Rate: 3-5% of views is typical, 7%+ is excellent
- Comment Rate: 0.5-1% of views is good, 2%+ is exceptional
- Share Rate: Highly variable, 0.1-0.5% is normal
Analyze Your Video Performance
Get instant analytics predictions and optimization suggestions before you upload with our Video Analyzer tool.
Analyze Your Video →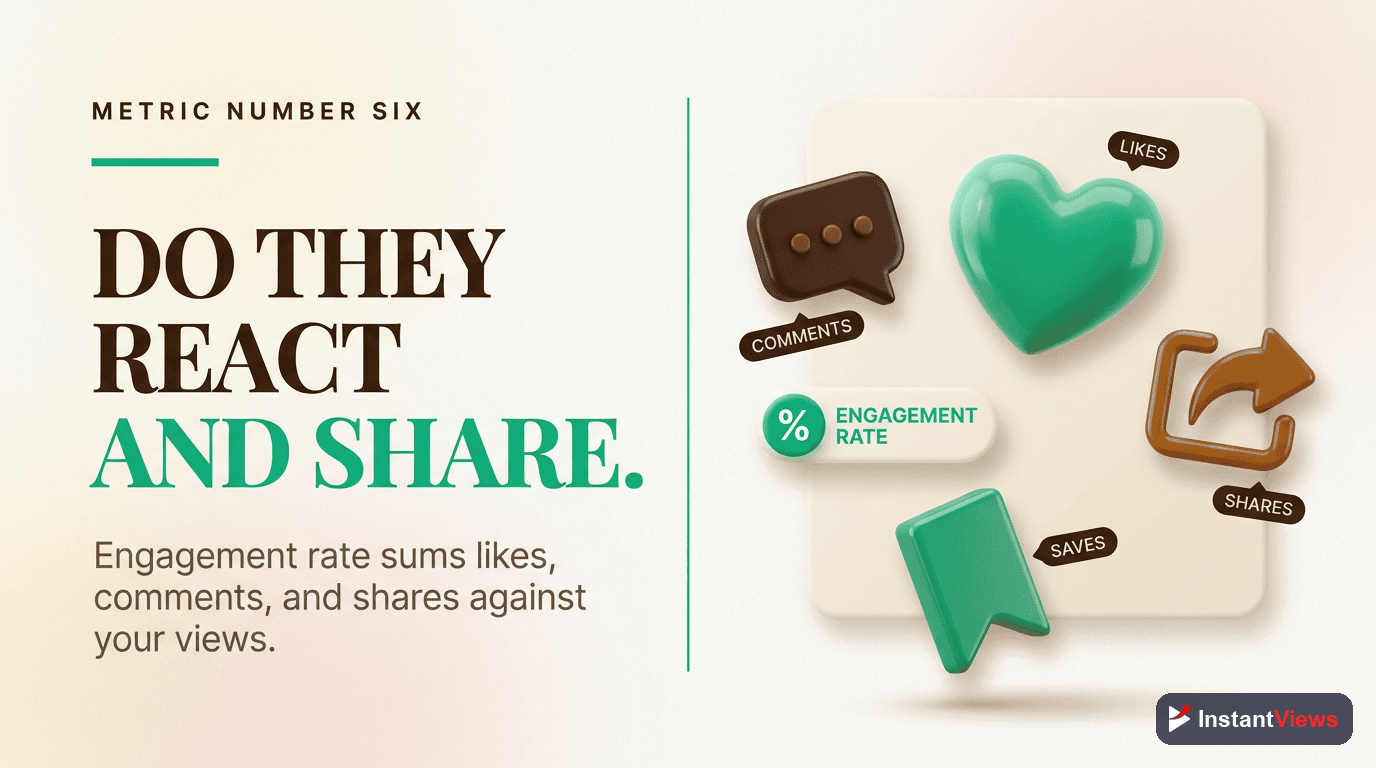
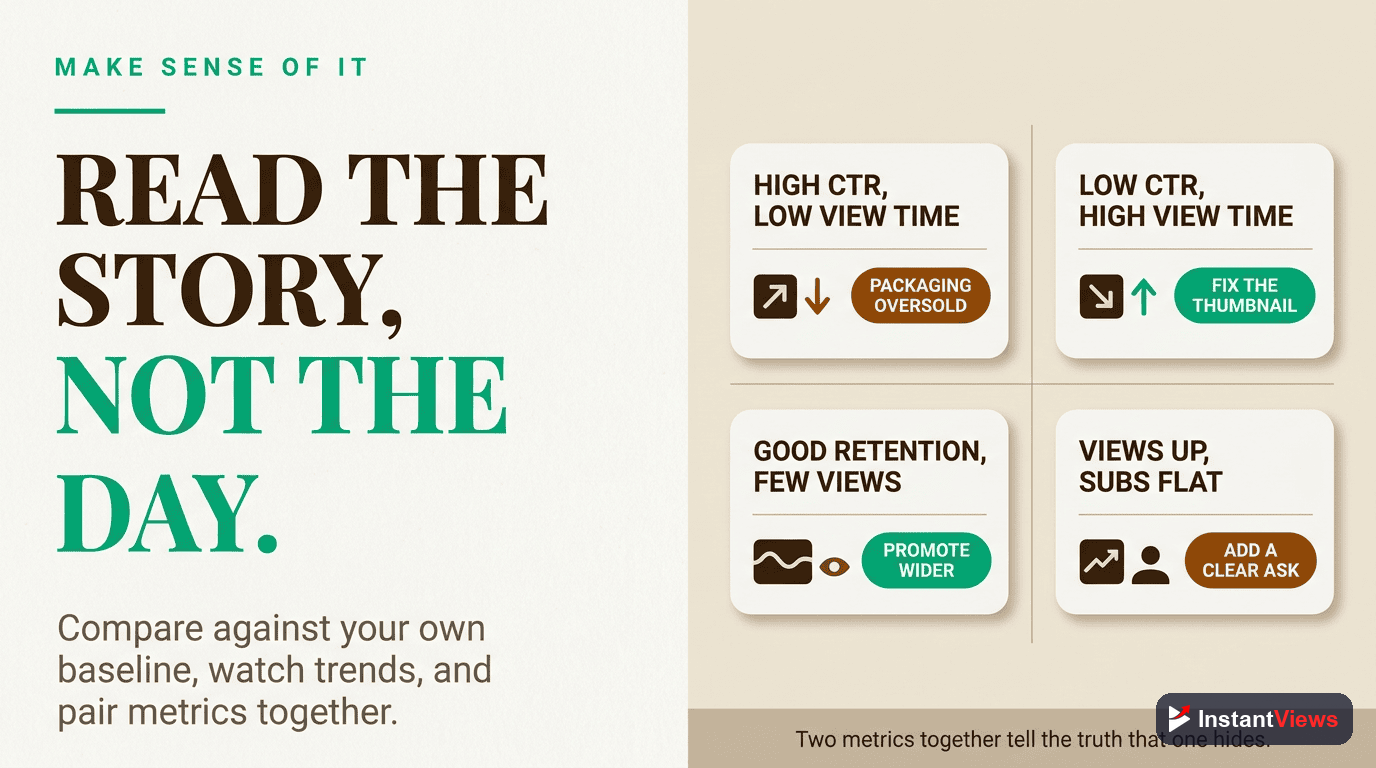
How to Interpret Your Data
Raw numbers mean nothing without context. Here's how to actually interpret your analytics:
The First 48 Hours Rule
The first 48 hours reveal your video's potential. Look for these signals:
| Signal | Strong Performance | Weak Performance |
|---|---|---|
| CTR | 6%+ in first 48 hours | Below 3% |
| AVD % | 50%+ of total length | Below 35% |
| Impressions | Growing exponentially | Flat or declining after 24h |
| 30s Retention | 70%+ still watching | Below 50% |
Compare Against Your Own Baseline
Stop comparing yourself to MrBeast. Instead, track your channel's baseline metrics:
- Calculate your average CTR across your last 10 videos
- Calculate your average AVD percentage
- Track your average 30-second retention rate
- Note your typical traffic source breakdown
Your goal is to beat YOUR baseline, not someone else's numbers.
Taking Action Based on Analytics
Data is useless without action. Here's exactly what to do based on your analytics:
If CTR is Low (Below 4%)
- Test new thumbnail styles using split testing
- Analyze top performers in your niche for thumbnail patterns
- Make titles more specific and benefit-focused
- Add numbers, power words, or curiosity gaps to titles
- Use the InstantViews analyzer to test variations
If AVD is Low (Below 40%)
- Improve your hook - first 30 seconds are critical
- Cut unnecessary intro fluff
- Increase pacing - edit tighter
- Add pattern interrupts every 60-90 seconds
- Ensure title promise is fulfilled early
- Consider shorter video length
If Retention Drops Sharply at a Specific Point
- Identify what happens at that timestamp
- If it's an intro, shorten or remove it
- If it's a segment, improve or cut it
- If it's a sponsor, consider placement timing
- Add a pattern interrupt right before the drop point
If Impressions are Low
- First, check if CTR and AVD are strong - if yes, be patient
- If metrics are weak, YouTube won't increase impressions
- Focus on improving content quality, not promotion
- Consider updating thumbnail/title if CTR is the issue
- Create content on trending or high-demand topics
Weekly Analytics Review Checklist
- Check performance of videos published in the last 7 days
- Identify your best performing video this week - what worked?
- Identify your worst performing video - what failed?
- Compare current week metrics to your baseline
- Note any trending topics or formats in your niche
- Plan next week's content based on what's working
"The creators who grow fastest aren't the most talented - they're the most analytical. They let data guide every decision."

Frequently Asked Questions
While all metrics have value, Average View Duration (AVD) is the most critical. YouTube's algorithm prioritizes videos that keep viewers watching longer. A high AVD signals quality content, leading to more recommendations and impressions.
Check analytics weekly for trends and within 48 hours after publishing new videos. The first 48 hours reveal crucial performance data about thumbnails, titles, and hooks. Weekly reviews help identify patterns and guide strategy adjustments.
A good CTR varies by niche and video type, but generally: 4-5% is average, 6-8% is good, and 10%+ is excellent. New channels often see 2-3% initially. Focus on improving your baseline rather than hitting arbitrary targets.
Start with a strong hook in the first 30 seconds, maintain pacing throughout, use pattern interrupts every 60-90 seconds, cut dead air and filler, add visual variety, and analyze retention graphs to identify drop-off points and improve future content.
Impressions are the number of times your thumbnail was shown to viewers on YouTube. This doesn't count external embeds or notifications. High impressions with low CTR means your thumbnail/title needs work. Low impressions means YouTube isn't recommending your video widely yet.
This is normal. Initial views come from subscribers and early recommendations. If performance metrics (CTR, AVD, engagement) are strong in the first 48 hours, YouTube will continue promoting your video. Weak initial metrics lead to decreased impressions and views.