- Channel growth is not random — views accumulate in recognizable patterns you can read in your own analytics
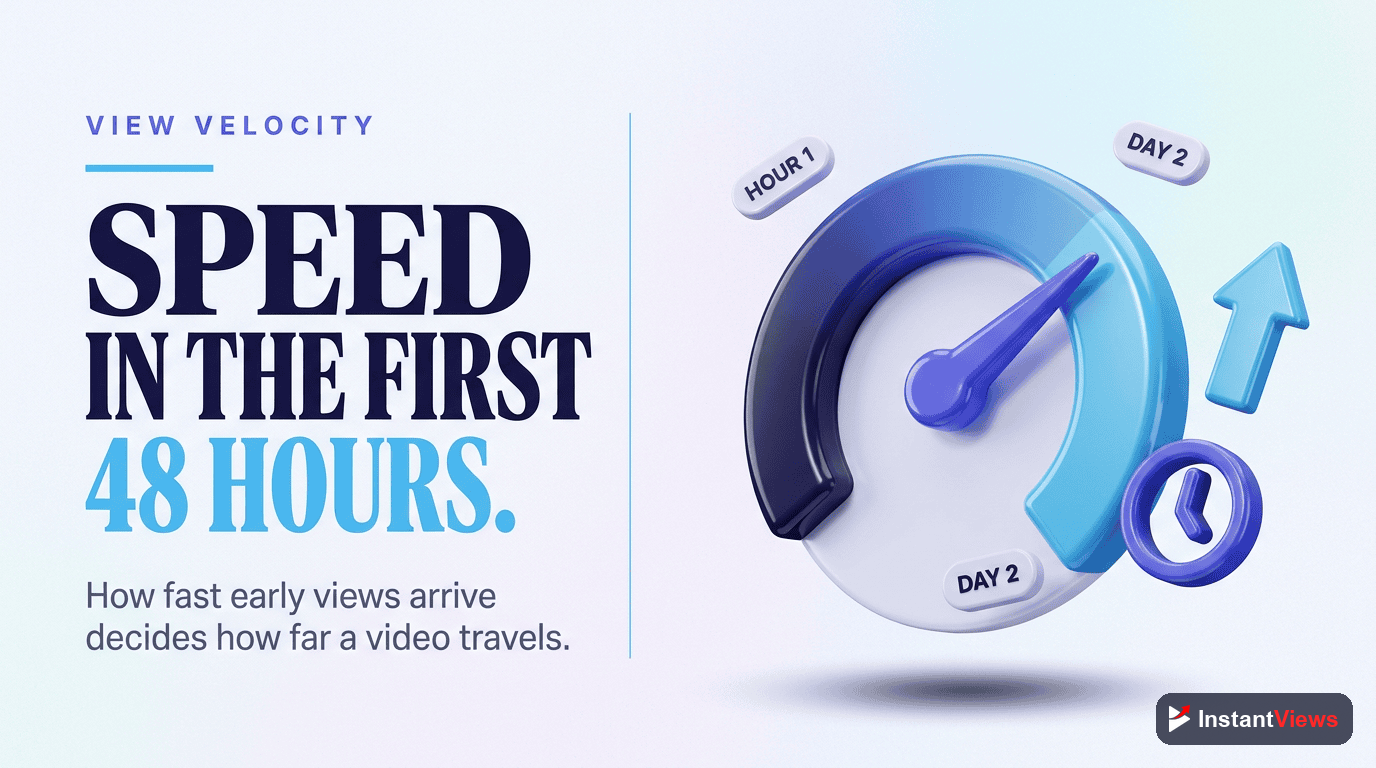
- View velocity (views per hour or day), not the final total, is what signals whether a video is accelerating
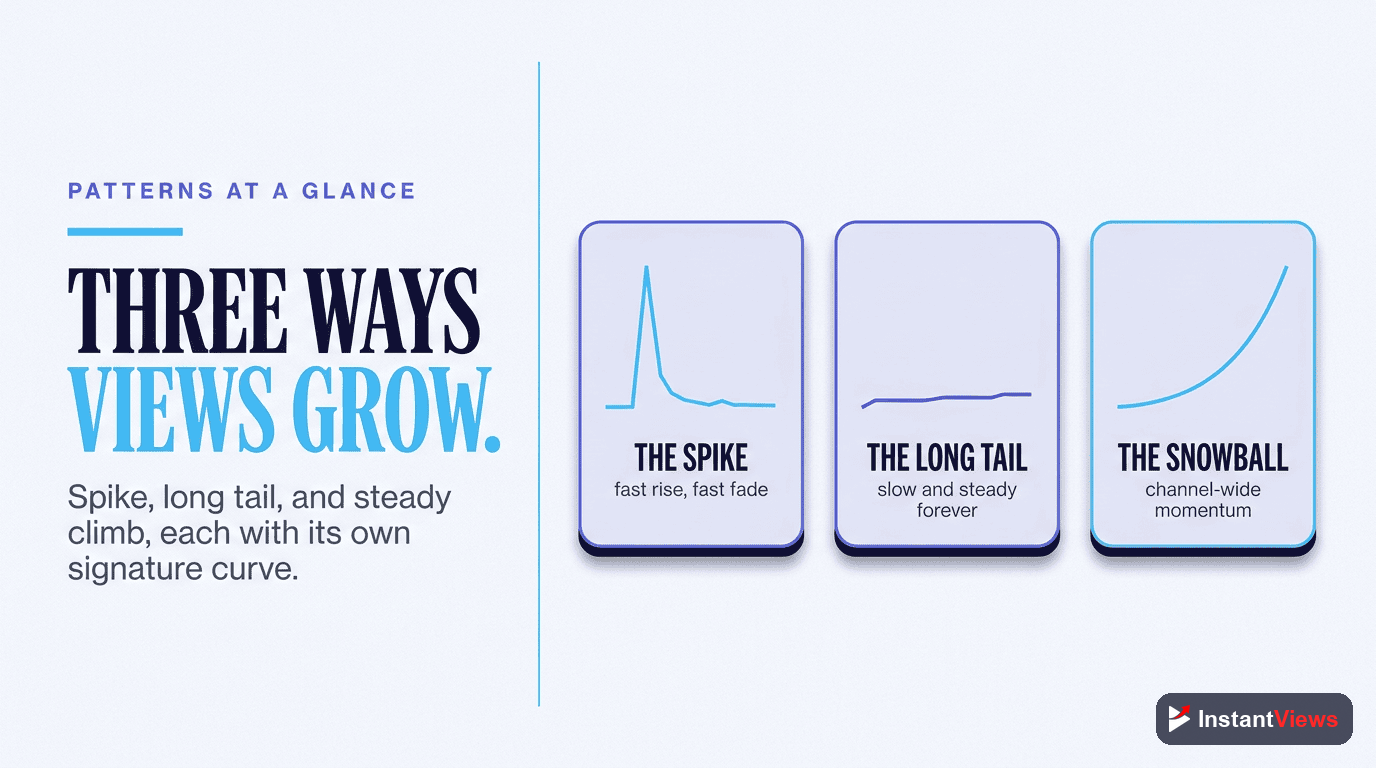
- Trending videos spike fast and fade; evergreen videos rise slowly but earn a long tail of views for months or years
- Suggested traffic makes a channel compound: strong videos feed viewers into your back catalog, so growth feels exponential
- Combine occasional spikes to find new viewers with an evergreen base that keeps them, and reinvest in whatever pattern compounds
If you have ever stared at your YouTube Analytics wondering why one video took off while another sank, or why your channel sat flat for a year and then suddenly seemed to take off on its own, you have run into the mathematics of growth. Views do not arrive randomly. They accumulate in patterns — curves with predictable shapes — and once you can read those shapes, your analytics stop feeling like noise and start telling a story.
YouTube is the largest discovery engine on the internet, with more than 2.7 billion monthly active users and over a billion hours of video watched every single day. At that scale, the way views spread through the platform behaves less like luck and more like a system. Some videos rise in a sharp spike and fall just as fast. Others creep upward for months and never seem to stop. And a channel as a whole can grow in a way that feels slow, then sudden — the classic shape of compounding.
This guide is about the math behind those shapes. Not invented formulas or fake precision, but the real, observable patterns: how view velocity works, why evergreen content has a long tail while trends have a spike, how suggested videos make your whole channel reinforce itself, and why growth so often feels exponential. Most importantly, you will learn to read these patterns in your own data so you can make better decisions about what to publish next.
You do not need to be a mathematician. You need to understand a handful of ideas — rate, accumulation, the long tail, and compounding — and then recognize them in the curves YouTube already draws for you.
- Growth Is Not Random: The Shape of Views
- View Velocity: The Rate That Drives Everything
- The Main View Patterns at a Glance
- The Spike: How Trending Views Accumulate
- The Long Tail: How Evergreen Views Accumulate
- Why Growth Compounds: The Channel Snowball
- A Worked Example of Compounding
- Reading These Patterns in Your Analytics
- Misreadings That Cost Creators Views
- FAQ
Growth Is Not Random: The Shape of Views
The single most useful mental shift a creator can make is to stop thinking about a video's total views and start thinking about how those views accumulated over time. Two videos can both reach one hundred thousand views and tell completely different stories. One might have earned ninety percent of those views in the first three days and then gone silent. The other might have earned a steady trickle every week for a year. Same total, opposite patterns, opposite lessons.
When you open a video's report and look at the views-over-time curve, you are looking at the accumulation of views — the running sum. The steepness of that curve at any point tells you how fast views are arriving right then. A curve that shoots up and flattens describes a spike. A curve that starts gentle and keeps climbing describes a long tail. A curve that bends upward over months, across many videos, describes a channel that is compounding.
This is why "did it do well?" is the wrong question. The better questions are: how fast did it gain views, where did those views come from, and is it still earning them now? Those three questions map directly onto velocity, traffic source, and the long tail — the three ideas this guide is built around.

View Velocity: The Rate That Drives Everything
View velocity is simply the rate at which a video gains views — views per hour in the first day, views per day in the first week. It is the slope of the accumulation curve, and it matters far more than the running total, because velocity is what the platform reacts to.
The 2026 algorithm optimizes for viewer satisfaction and retention. When a fresh video earns strong velocity and holds attention, YouTube reads that as evidence the video is worth showing to more people, and it widens distribution. More distribution produces more views, which can sustain the velocity, which earns still more distribution. That feedback loop is the engine behind every breakout video — and it is driven by rate, not by the eventual total.
Velocity is also relative. Two hundred views in an hour means nothing in isolation; it means a great deal if your channel average is twenty. This is why you should always compare a new video's early velocity to your own baseline, not to other creators. A few signals to watch in the opening window:
- Views per hour versus your average: a video pulling far above your norm early is a candidate for wider reach.
- Retention alongside velocity: fast views with weak retention rarely sustain — the algorithm needs both.
- The direction of the trend: is velocity rising, holding, or already falling by the second day?
- The traffic source feeding it: velocity from suggested behaves differently from velocity from search, as we will see.
The Main View Patterns at a Glance
Most videos follow one of a few recognizable curves. Learning to name them on sight makes your analytics far easier to read. The table below summarizes what each pattern looks like and what it actually means for your channel.
| View Pattern | What It Looks Like | What It Means |
|---|---|---|
| Trending spike | Sharp rise in the first hours or days, then a fast drop to near zero | Tied to a moment or trend; great reach now, little durable value once interest fades |
| Evergreen long tail | Slow start, then a steady or gently rising line that continues for months | Fed by search and suggested; the majority of views often arrive long after upload |
| Slow burn to breakout | Flat for weeks, then a sudden climb when the algorithm picks it up | The video found its audience late; patience and good metadata paid off |
| Flat line | Low, near-horizontal from day one and never recovers | Weak velocity or retention early; the algorithm stopped testing it |
| Channel snowball | The whole channel’s views bend upward across many videos at once | Compounding: videos are feeding viewers to one another through suggested |
No single video tells you everything. But once you can glance at a curve and place it in this table, you can stop guessing and start asking the right follow-up question — usually about traffic source or retention.
The Spike: How Trending Views Accumulate
A spike is what most people picture when they imagine "going viral." A video catches a trend, a news moment, or a wave of shares, and views arrive in a flood. The accumulation curve rockets upward in the first hours or days — very high velocity — and then bends flat almost as quickly as interest in the moment dies.
Spikes are real and valuable, but their math has a catch: the area under a spike is mostly earned up front. There are roughly two flavors. A pure news-cycle trend can rise and collapse within about forty-eight hours, rewarding speed above all else — if you cannot publish while the moment is hot, the window closes. A trend with evergreen roots holds interest for a week or two before flattening, giving you a little more room. Either way, the defining trait is the same: fast up, fast down.
The strengths and limits of spikes
- Strength: a spike can put your channel in front of a huge number of new viewers in a very short time.
- Strength: that burst of attention can convert into subscribers and feed your other videos — if you capture it.
- Limit: the views stop almost as fast as they started, so a spike does not build a durable base by itself.
- Limit: a channel built only on spikes effectively resets between hits, because each new upload starts from cold.
The smart way to use a spike is as a discovery event: a moment to acquire new viewers cheaply, then guide them toward the evergreen content that will keep them. The spike brings the crowd; your durable videos decide whether the crowd stays.

The Long Tail: How Evergreen Views Accumulate
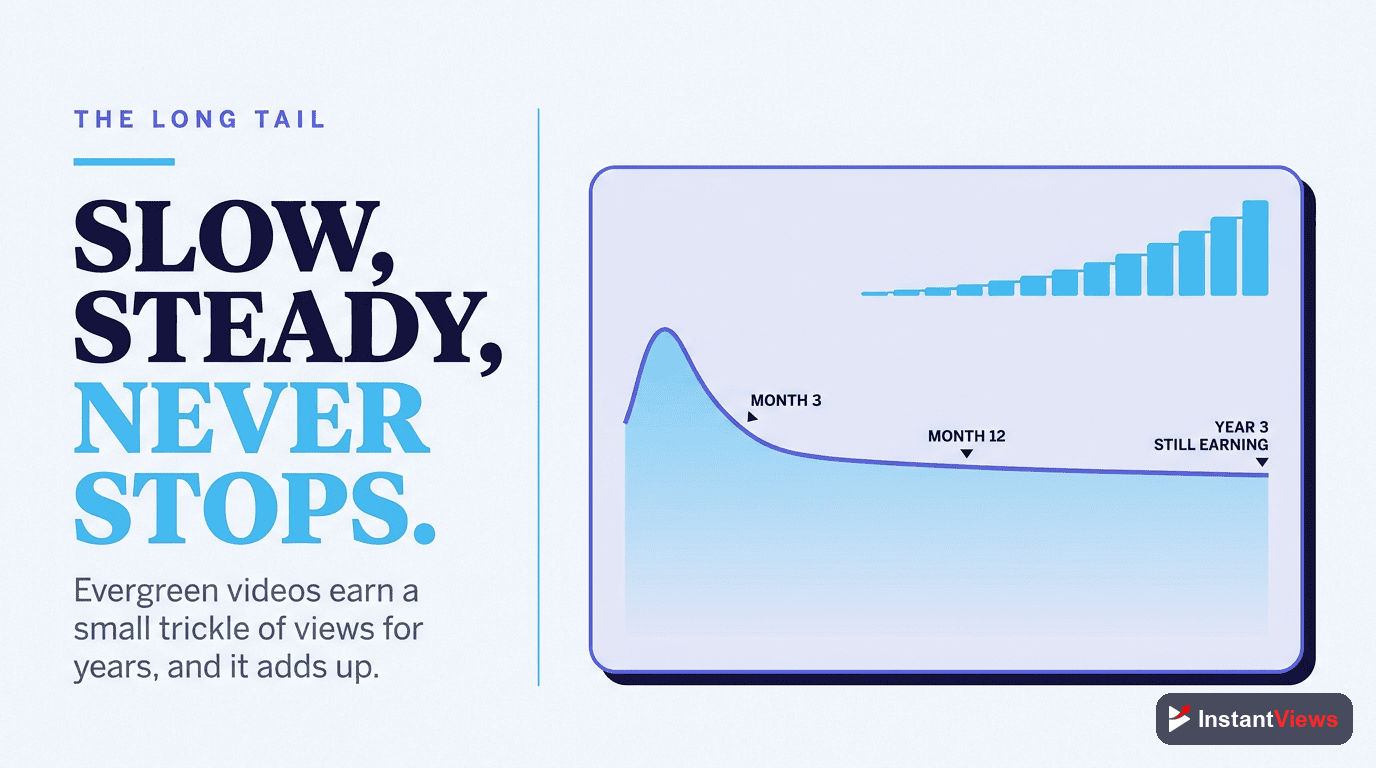
The opposite of a spike is the long tail, and it is where most of YouTube's quiet, durable value lives. An evergreen video — a tutorial, an explainer, a "how to" or "best of" that stays relevant — often starts slow. Its first week looks unremarkable. But because it answers a question people keep asking, search and suggested feeds keep surfacing it, and it keeps earning views week after week, month after month.
The striking thing about evergreen accumulation is where the views come from in time. A large share of an evergreen video's lifetime views frequently arrives after the first month, not before it. The curve is shallow early and stays alive for a very long time, so the total area underneath can dwarf that of a spike that looked far more impressive on day one.
Why the long tail compounds inside a single video
Each time YouTube shows an evergreen video and a viewer watches it through, the platform gathers more evidence that the video satisfies that search or that audience. That evidence earns more impressions, which earn more watch-throughs, which earn more confidence. A well-titled, well-described evergreen video can therefore accelerate over its first months rather than decay — the slow-burn-to-breakout pattern from the table.
Do not delete or write off a video because it looked flat in its first week. Evergreen content routinely earns the bulk of its views well after the first month. Judging long-tail content on a 7-day window is one of the most common and costly misreadings creators make.
Why Growth Compounds: The Channel Snowball
So far we have looked at single videos. The most important math, though, happens at the level of the whole channel — and it is the reason growth so often feels slow for a long time and then suddenly fast.
The mechanism is suggested traffic. Suggested videos appear in the sidebar on desktop and in the up-next feed on mobile, recommending content related to whatever someone is currently watching. As your library grows and YouTube learns that your videos share an audience, it begins recommending your videos to each other. One strong video becomes a doorway: a viewer arrives through it, then flows into a second video, then a third. Each upload can lift the ones you published months ago, and they in turn lift the new one.
This is compounding. It is the same idea as interest building on interest: growth feeds on the growth that came before it. The channel-level loop looks like this:
- Great content earns retention — viewers stay and watch through.
- Retention earns distribution — the algorithm shows the video to more people.
- Distribution earns new viewers — reach widens into fresh audiences.
- Those viewers flow to your other videos — through suggested and your back catalog.
- The added watch time and clearer audience signal help your next upload start faster.
Because each loop makes the next one easier, the channel's total views curve bends upward. No single video has to explode for this to happen — a stack of evergreen videos quietly reinforcing one another produces a curve that feels exponential, even when every individual video is growing modestly. That is the snowball: small, durable layers of views that start feeding each other once there are enough of them.
"A spike is a single firework. A compounding channel is a fire that the early logs keep feeding — which is why the hard part is the beginning, before there is enough fuel for the videos to light each other."

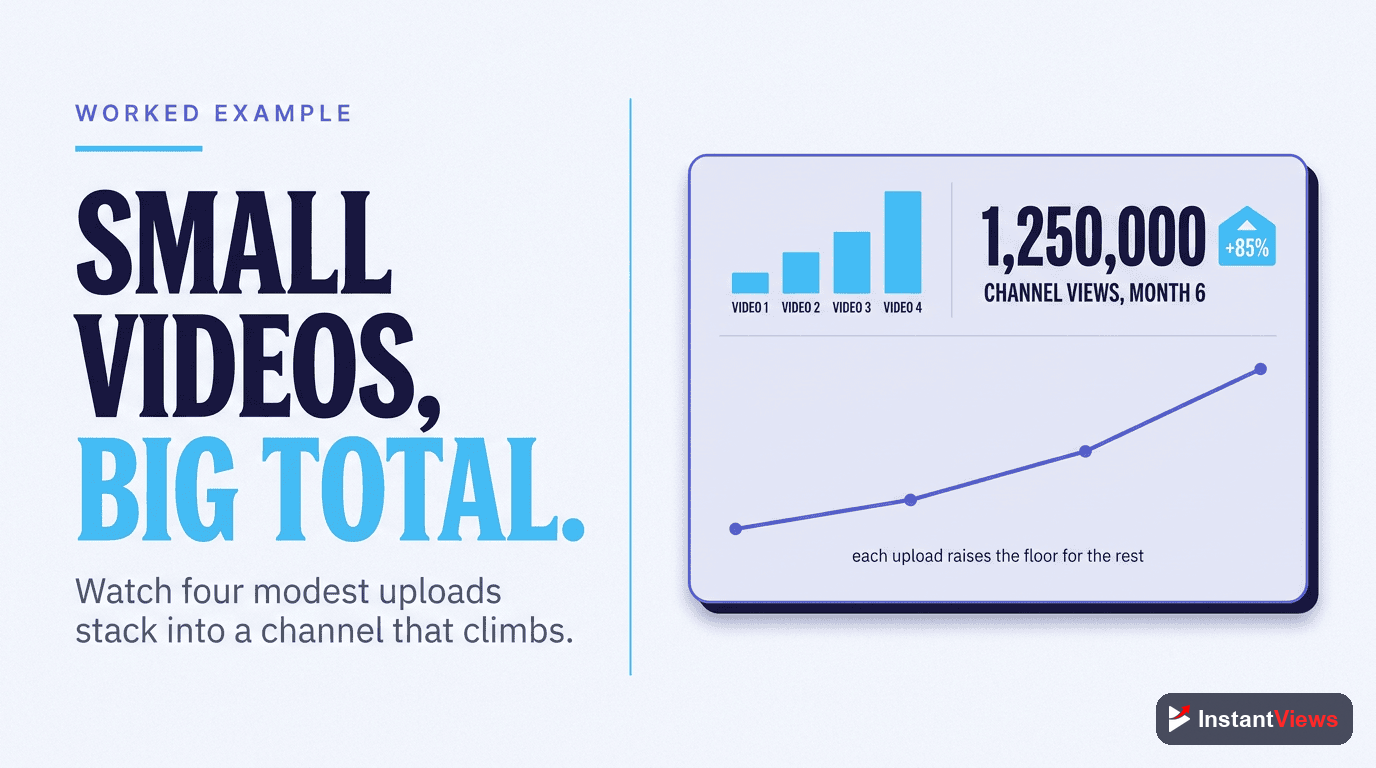
A Worked Example of Compounding
Let us make the snowball concrete with a simple, illustrative walkthrough. The numbers here are a made-up example to show the shape of compounding, not a benchmark or a promise — your real figures will differ.
Imagine a channel that publishes one evergreen video a month, and suppose each video, once it matures, settles into earning a steady 100 views a day from search and suggested. Watch what happens to the channel's daily views over the first year purely from accumulation:
- Month 1: 1 video maturing — roughly 100 views a day.
- Month 3: 3 videos in the library — roughly 300 views a day, with no single video doing anything special.
- Month 6: 6 videos — roughly 600 views a day.
- Month 12: 12 videos — roughly 1,200 views a day, and climbing every month.
If that were the whole story it would be merely additive — a straight line. But compounding adds a second effect on top of it. As the library grows, those videos begin feeding viewers to one another through suggested, so a viewer who arrives for one video watches two or three. That cross-traffic lifts the per-video daily rate over time, and the clearer audience signal helps each new upload mature faster than the last. The straight line bends into a curve.
The practical lesson is the part most creators miss: the early months feel discouraging precisely because compounding has not started yet. With one or two videos there is nothing to feed and nothing to be fed. The channel looks flat. Then, somewhere past a critical mass of related, well-optimized videos, the loops connect and the curve lifts off — the same channel, the same effort per video, a completely different trajectory. Quitting in month three means quitting right before the math turns in your favor.
Reading These Patterns in Your Analytics
All of this theory is only useful if you can see it in your own data. The good news is that YouTube Analytics already draws every one of these curves for you — you just need to know which report shows which pattern. Here is a simple sequence for reading your own view patterns.
Read the Shape, Not the Total
Open a video’s views-over-time chart and identify the curve: spike, long tail, slow burn, or flat. The shape tells you more about what to do next than the headline view count ever will.
Measure Velocity Against Your Baseline
Compare the video’s early views per hour and per day to your channel average. Note whether velocity is rising or falling — direction matters more than the snapshot.
Check the Traffic Source
Use the reach report to see how much comes from search, suggested, and browse. Search-heavy videos tend to be long-tail evergreens; suggested-heavy videos are where your compounding lives.
Find Your Cross-Traffic
Look at returning versus new viewers, and at which videos lead viewers to your others. This reveals which uploads are acting as doorways into your back catalog — the engines of the snowball.
Reinvest in What Compounds
Make more of the evergreen topics that keep earning views month after month, and use occasional trend videos to pour new viewers into that durable base. Double down on the pattern that is already working.
See Your View Patterns Clearly
Explore our free suite of YouTube tools to research evergreen topics, optimize titles, and spot which of your videos are compounding.
Explore Free YouTube Tools →
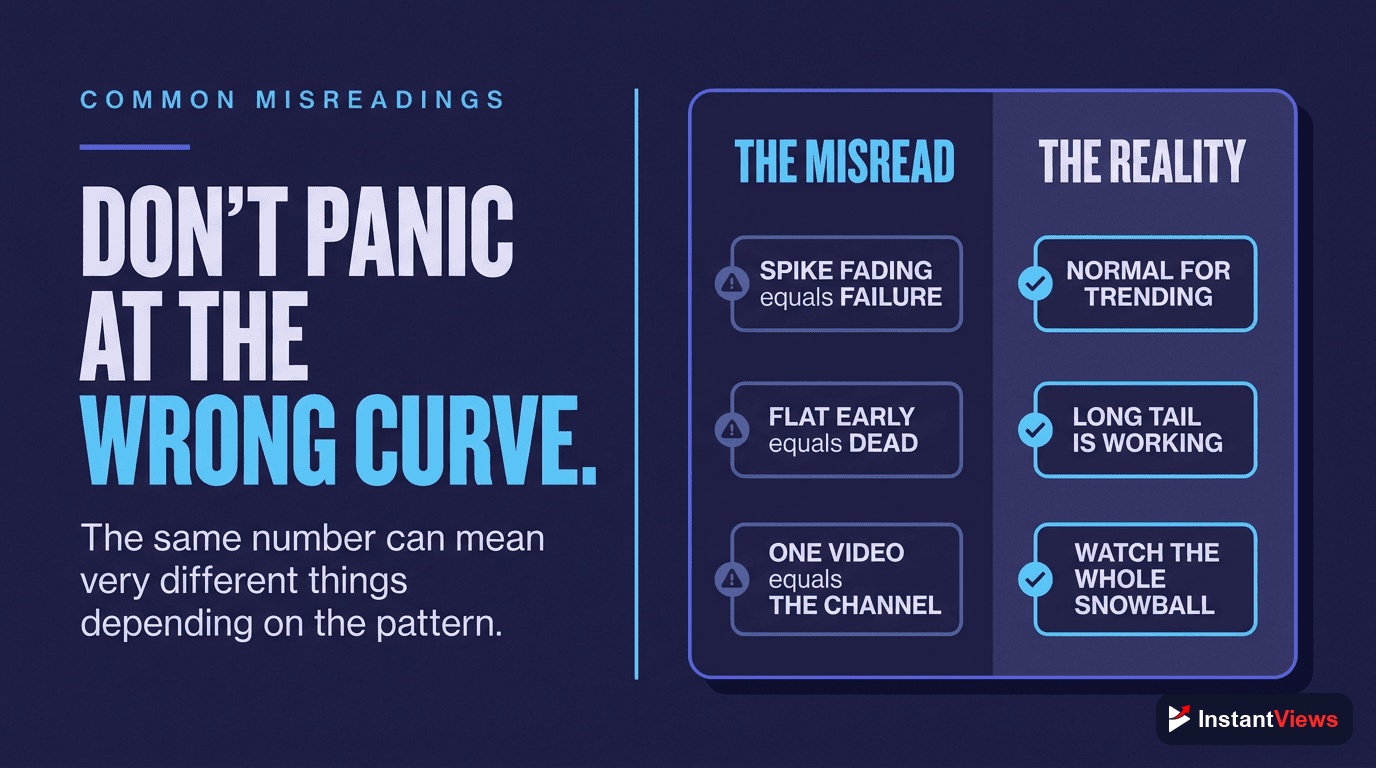
Misreadings That Cost Creators Views
Most creators are not held back by a lack of data — they are held back by misreading the data they already have. These are the most common and most expensive misreadings of view patterns:
- Judging evergreen content on a 7-day window: deleting or abandoning videos that simply had not reached their audience yet, when the long tail was still coming.
- Chasing spikes as a strategy: building a channel only on trends, so it resets to cold between hits and never compounds.
- Watching totals instead of velocity: celebrating a big number that has already stalled while ignoring a smaller one that is still accelerating.
- Scattering topics: publishing unrelated videos so YouTube never learns the channel’s audience, which starves the suggested loop and delays the snowball.
- Quitting during the flat months: abandoning the channel in the additive phase, right before there is enough fuel for compounding to begin.
- Ignoring retention: assuming velocity alone drives reach, when the 2026 algorithm rewards satisfaction and retention, and fast views without watch-through fade quickly.
Notice the thread running through all of them: each mistake comes from reading a single number at a single moment instead of reading the pattern over time. The math of growth is a story told in curves, and the creators who learn to read those curves make calmer, better decisions — they hold their nerve through the flat months and pour their effort into the videos that are quietly compounding.
Frequently Asked Questions
Because views feed views. Each video that performs well earns more impressions in search and suggested feeds, which sends viewers to your other videos, which lifts the whole channel. When several videos reinforce one another at once, the combined effect grows faster than any single video could, so the curve bends upward and feels exponential even though no individual video is exploding.
View velocity is the rate at which a video gains views over a given period — views per hour or per day rather than the raw total. YouTube watches early velocity closely because a video pulling strong views and retention quickly is a signal that it deserves wider distribution. Velocity, not the final view count, is what tells you whether a video is accelerating or cooling off.
A trending spike rises fast and falls fast: a topic tied to a moment or news cycle can pull huge views in days, then fade as interest disappears. An evergreen long tail rises slowly but keeps earning views for months or years through search and suggested traffic, because the topic stays relevant. Spikes give you reach now; the long tail gives you compounding views later.
Longer than most creators think. Evergreen videos often earn the majority of their lifetime views well after the first month, as search and recommendations slowly pick them up. A video that looks flat in week one can become a steady performer by month three. Judge search-driven and tutorial content on a horizon of months, and only judge trend-driven content on the first days.
Suggested videos appear in the sidebar and the up-next feed, recommending content related to whatever a viewer is watching. When YouTube understands that your videos share an audience, it begins suggesting them to each other. One strong video then becomes a doorway that feeds traffic into your back catalog, so every new upload can lift the videos you published months ago.
Yes, indirectly. A larger library of related, well-optimized videos gives YouTube more surfaces to recommend and more chances to keep a viewer on your channel. It also gives the algorithm more data about who your audience is. That clearer audience signal helps your next upload find the right viewers faster, which is part of why growth tends to accelerate as a channel matures.
Absolutely. The reach and traffic-source reports show whether a video is fed by search, suggested, or browse; the views-over-time curve shows whether it spiked or is building a long tail; and the audience report shows returning versus new viewers. Reading these together tells you which pattern a video is following and where your compounding is coming from.
Not necessarily. A viral spike brings a flood of new viewers, but many never return, and a channel built only on spikes resets to zero between hits. Slow, evergreen growth compounds: each video adds a durable layer of views and a clearer audience. The strongest channels combine the two — using occasional spikes to find new viewers and evergreen depth to keep them.
Conclusion
YouTube growth can feel like a mystery, but it is closer to a system with a few readable rules. Views accumulate in patterns — the fast rise and fall of a spike, the slow durable climb of an evergreen long tail, and the upward bend of a channel whose videos have begun feeding one another. Once you can see those shapes, the chaos resolves into something you can actually plan around.
The most important idea is compounding. A single video is a firework; a focused library of evergreen videos is a fire that keeps itself burning, because each one sends viewers to the others through suggested traffic. That is why growth feels slow and then sudden, and why the hardest stretch is the beginning — before there is enough fuel for the videos to light each other.
So watch velocity rather than totals, give your evergreen videos months rather than days, cluster your topics so the snowball forms sooner, and read your traffic sources to find where compounding is already happening. Do that consistently, and the mathematics of growth stops working against you and starts working for you — long after you hit publish.